Custom Source Layers
in this lesson
Custom Sources are a way to bring in additional layers and overlays to CalTopo from outside sources. The ability to display additional geographic information in CalTopo is dependent on two initial factors:
- The data must be hosted as a map server. This is what a map server page typically looks like, Snow Analysis
- The data must be in one of three formats: Tile, TMS, or WMS.
Custom Source Layers require a Pro or higher subscription.
Topics on this Page:
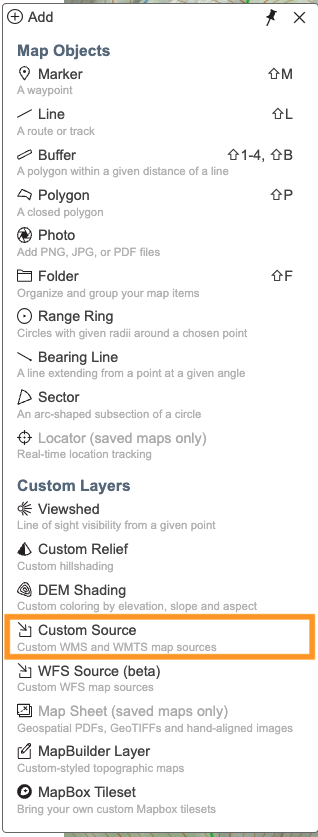
- Creating a Custom Source Layer
- Example 1 FEMA National Flood Hazard Layer
- Example 2 British Columbia Aerial Image
Creating a Custom Source Layer
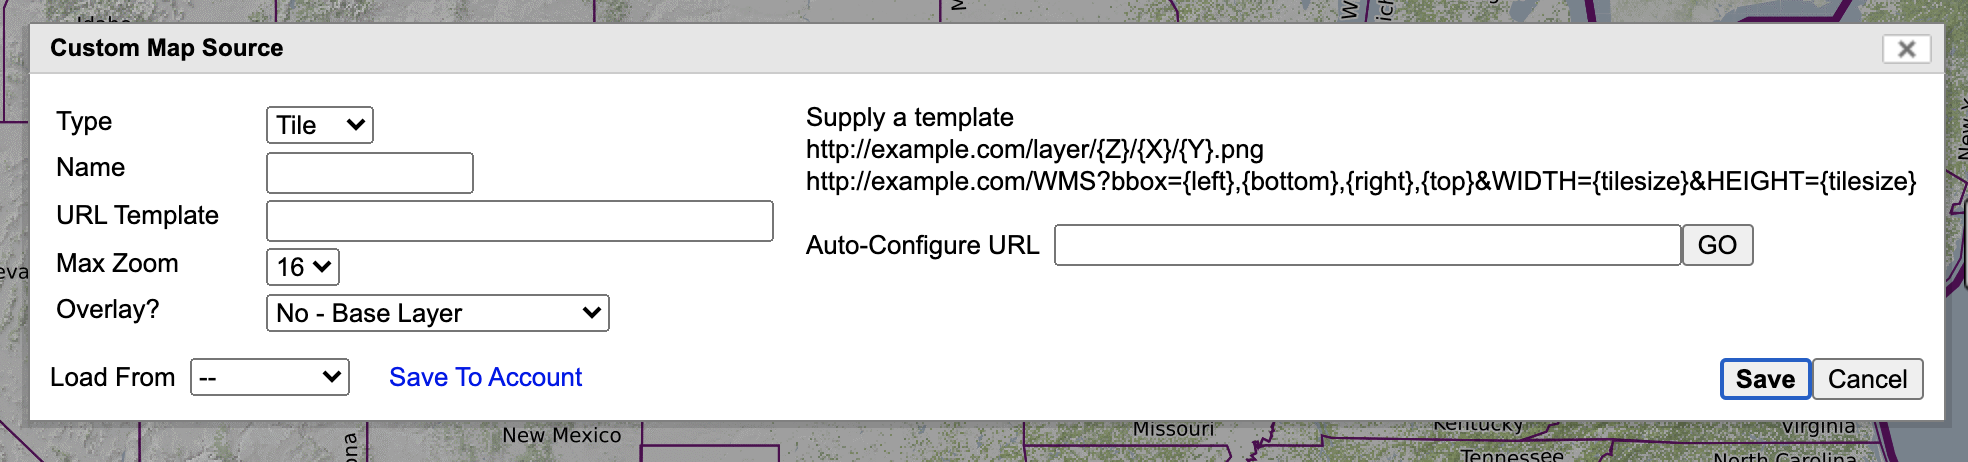
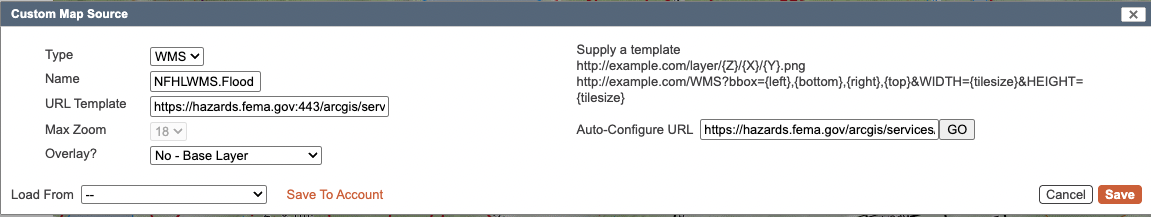
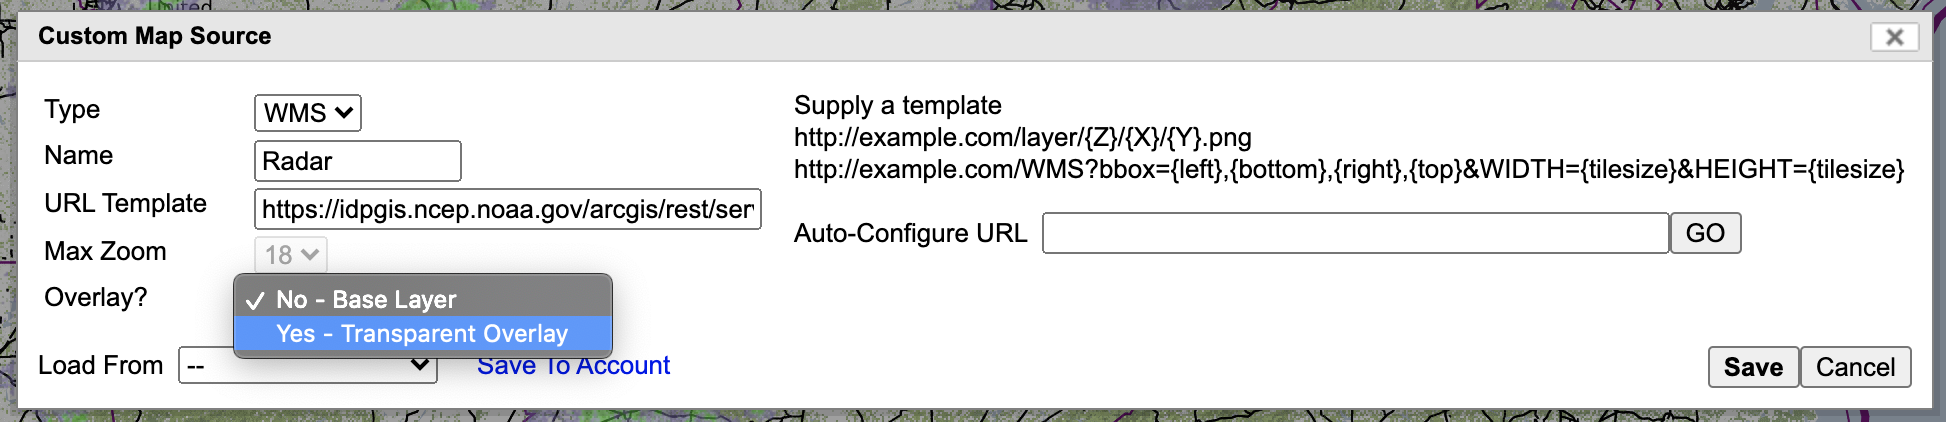
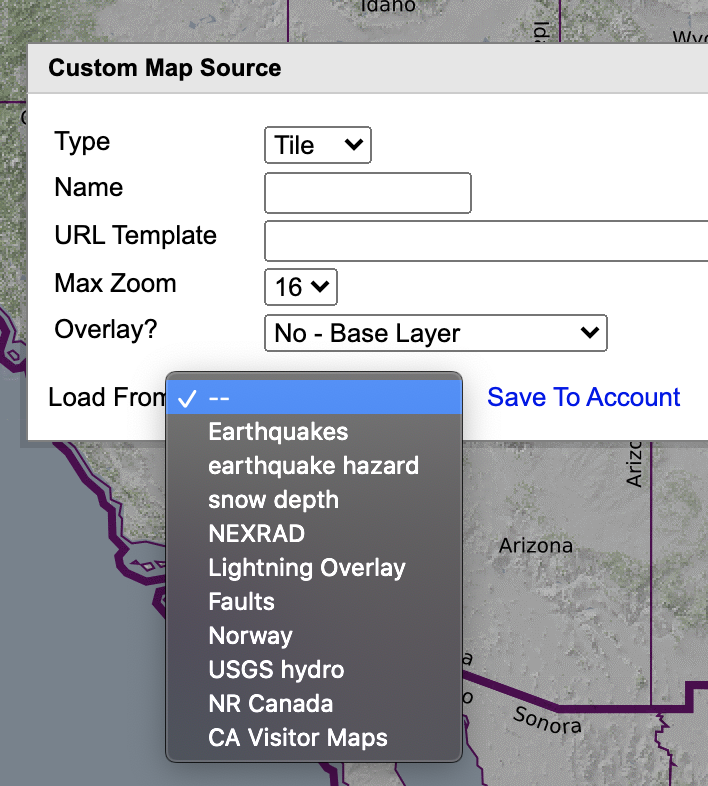
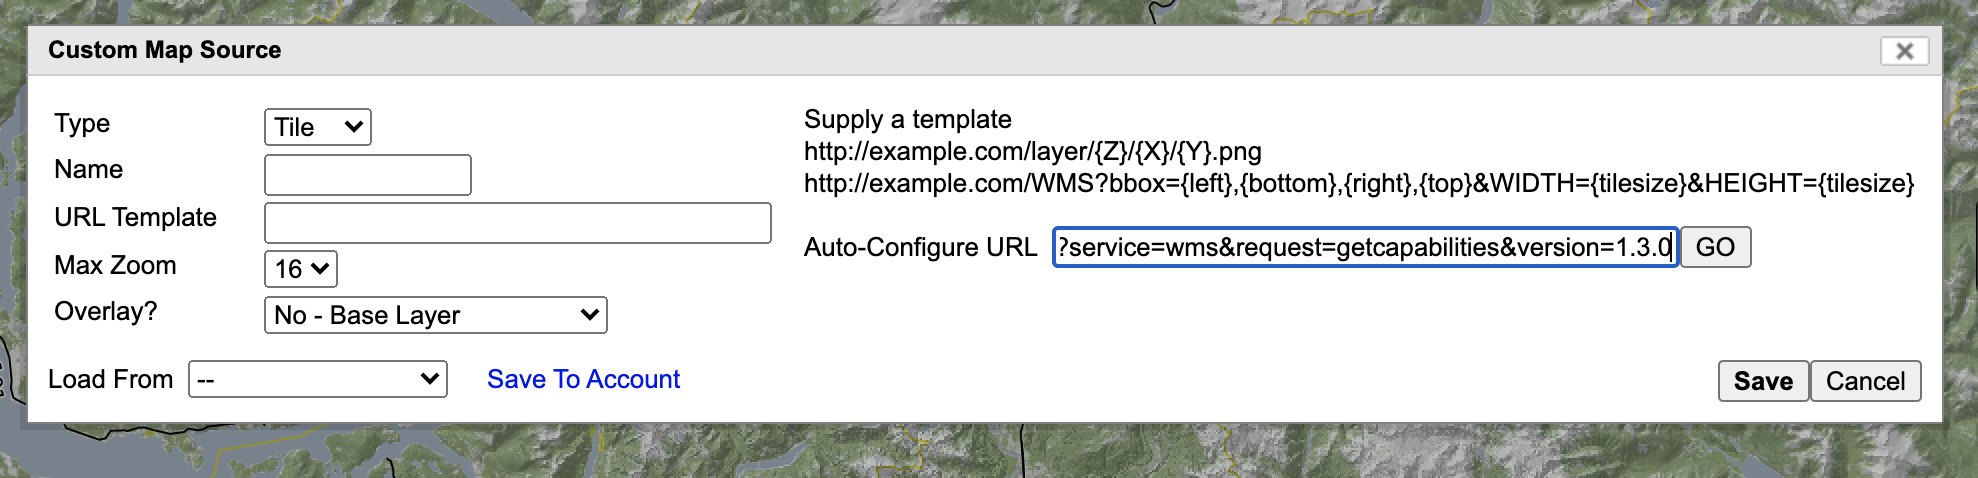
Let's start by taking a look at the edit box for adding a layer from a Custom Source.
In the edit box, there are three areas where you can input information: Name, URL Template, and Auto-Configure URL. If you have the URL of the Tile, TMS, or the WMS you can put it into the auto-configure box, and we will configure the API and populate the URL template with that information. You would use the URL template only if the API is already configured. The name is something you can choose that best describes the layer. More information on finding the URL to put into the auto-configure box and on choosing a label is provided below.
Custom sources often have limitations in the ways they can display. For example, they do not zoom very well and work best at only a few zoom levels. Some will only display as an overlay and not as a layer, or they will work better as a layer rather than an overlay.
Saving To and Editing From Custom Layers in Your Account
Once you create a custom layer you can save the layer to your account, click Save to Account at the bottom left of the edit box, as described in the custom layers introduction lesson. Editing is also covered there.
Example 1: FEMA National Flood Hazard Layer
If you're already familiar with the formatting requirements, you can proceed to bring in a new data source. Here are two examples, including links to the data if you want to try them out yourself.
First, locate a link that either functions as a direct URL template matching one of the supported formats, or use a link that can be entered into the auto-configure box, allowing CalTopo to generate the correct format for you.
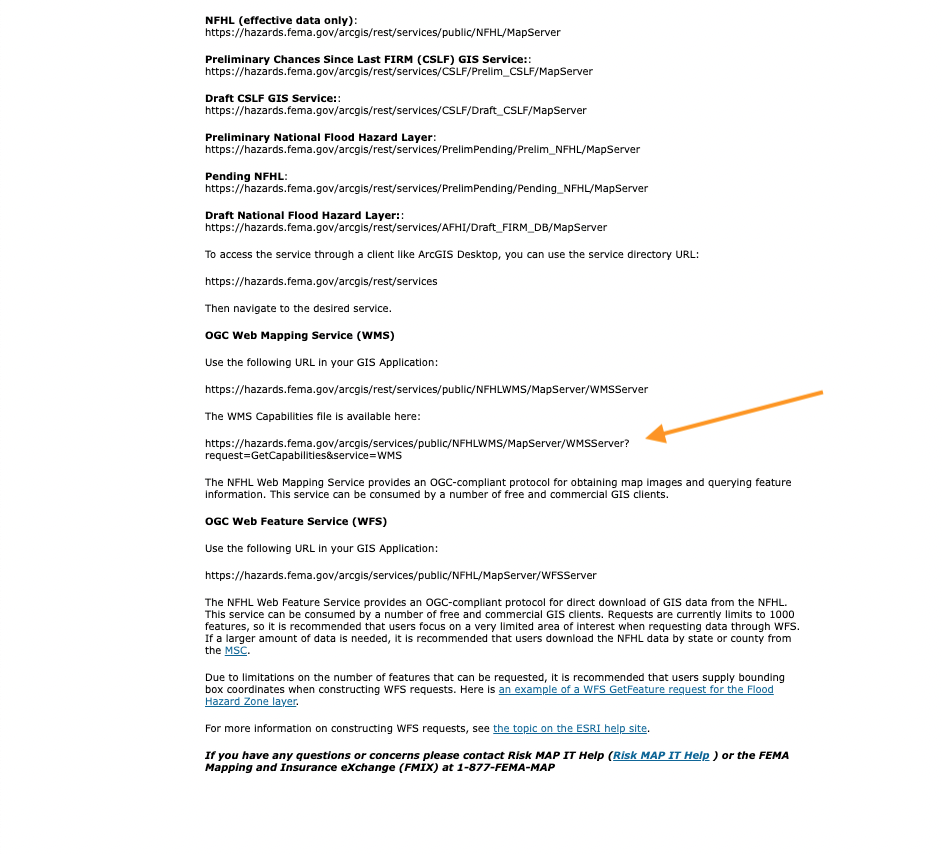
In the U.S., we have access to FEMA's flood hazard layer, and the link for the source can be found here near the bottom of the page.
To locate similar data sources, try searching for your desired dataset along with terms like “web services,” “map server,” or “REST services.”
From the link above, we found:
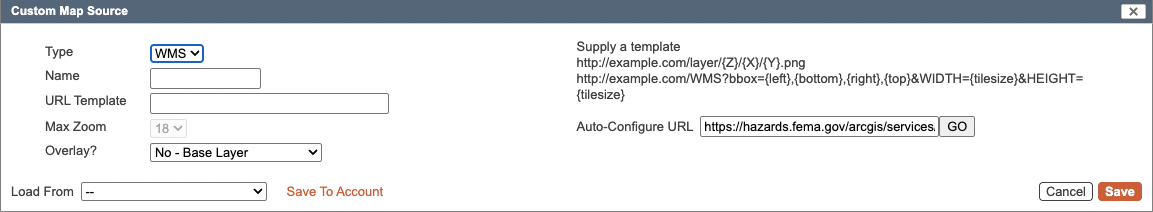
https://hazards.fema.gov/arcgis/services/public/NFHLWMS/MapServer/WMSServer?request=GetCapabilities&service=WMS
near the bottom of the page.
Paste the link into the auto-configure box and click “GO.”
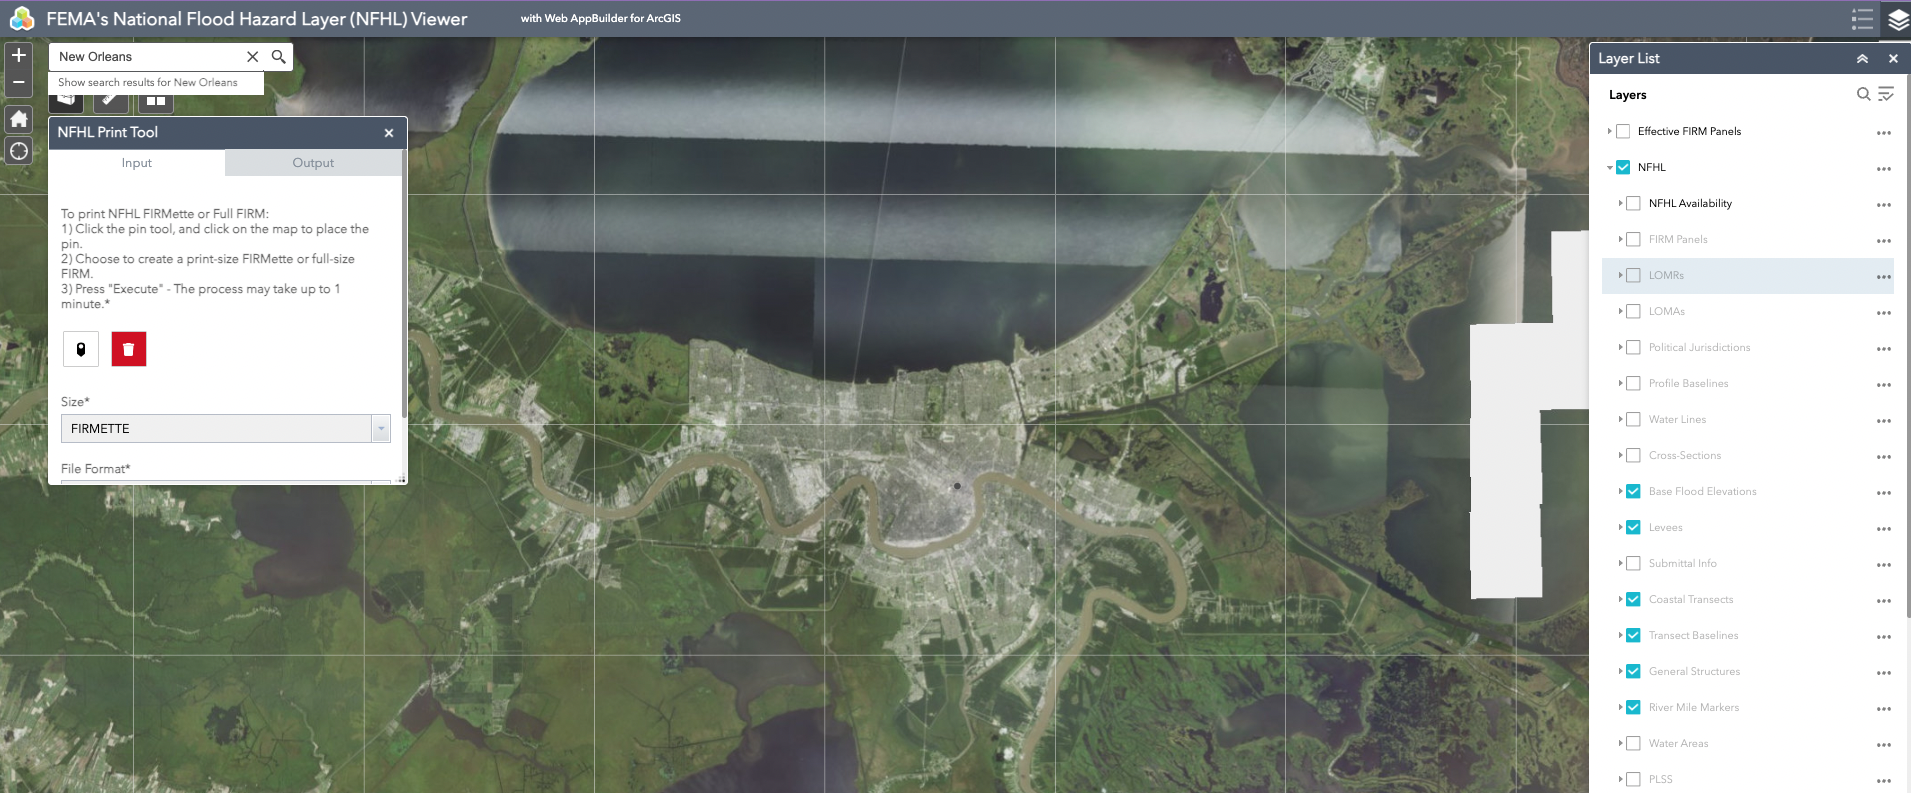
A box will appear, allowing you to select which layers from the source should be included in your display. If you’re not familiar with FEMA National Flood Hazard Layers, you can visit this FEMA web map, zoom into your area of interest, click the layers icon, and expand the NFHL to see the list. Clicking on a list item displays a legend, which may be worth screenshotting.
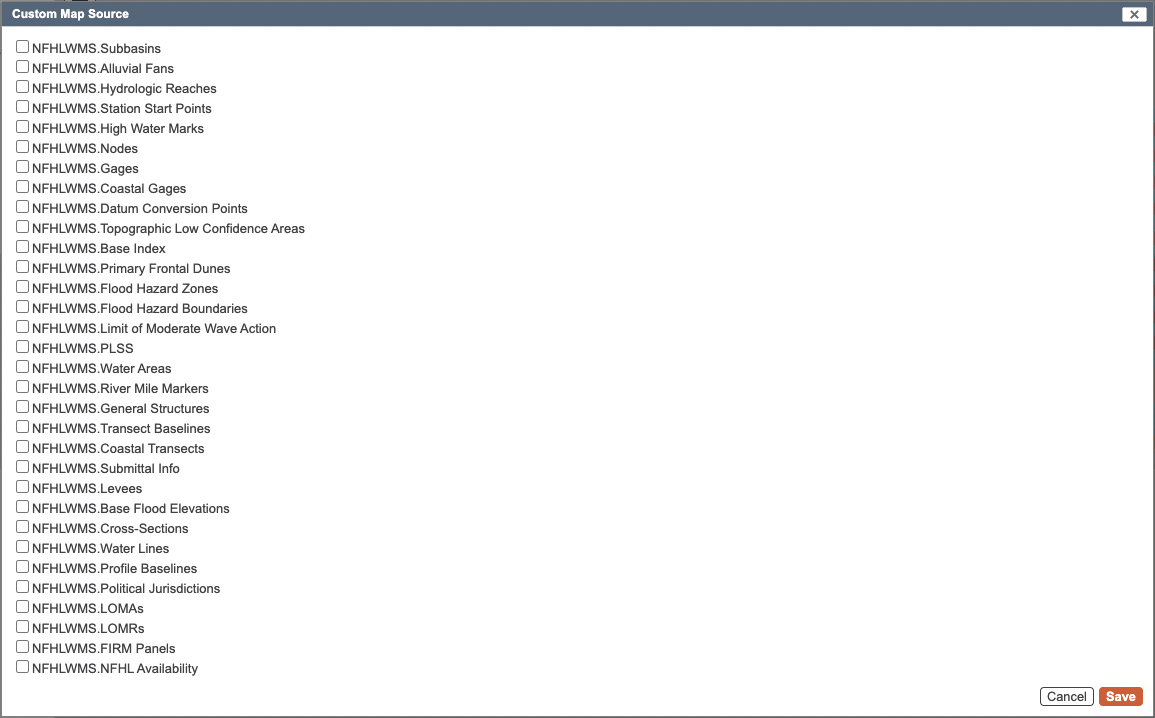
After selecting a layer—here, we choose NFHLWMS Flood Hazard Zones—click Save.
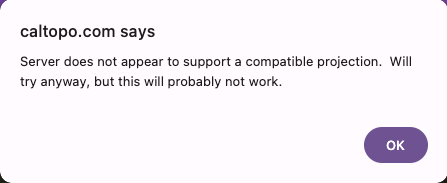
You may encounter an error message, which you can dismiss by clicking OK.
After clicking Go, a new link appears in the URL template box. Add a title for your layer and press Save to display it on your map.
You now have a new layer, which works like other CalTopo layers—you can stack them, adjust opacity, etc. However, some layers—like NFHLWMS Flood Hazard Zones—may display a gray background that covers the base layer. When this happens, you’ll need to edit the URL created in the URL Template box. For example, the original URL is:
https://hazards.fema.gov:443/arcgis/services/public/NFHLWMS/MapServer/WMSServer?SERVICE=WMS&VERSION=1.1.1&REQUEST=GetMap&STYLES=&BBOX={left},{bottom},{right},{top}&WIDTH={tilesize}&HEIGHT={tilesize}&BGCOLOR=0xCCCCCC&FORMAT=image/png&EXCEPTIONS=application/vnd.ogc.se_inimage&SRS=EPSG:4326&LAYERS=12
Edit it by adding TRANSPARENT=True so it becomes:
https://hazards.fema.gov:443/arcgis/services/public/NFHLWMS/MapServer/WMSServer?SERVICE=WMS&VERSION=1.1.1&REQUEST=GetMap&STYLES=&BBOX={left},{bottom},{right},{top}&WIDTH={tilesize}&HEIGHT={tilesize}&TRANSPARENT=True&BGCOLOR=0xCCCCCC&FORMAT=image/png&EXCEPTIONS=application/vnd.ogc.se_inimage&SRS=EPSG:4326&LAYERS=12
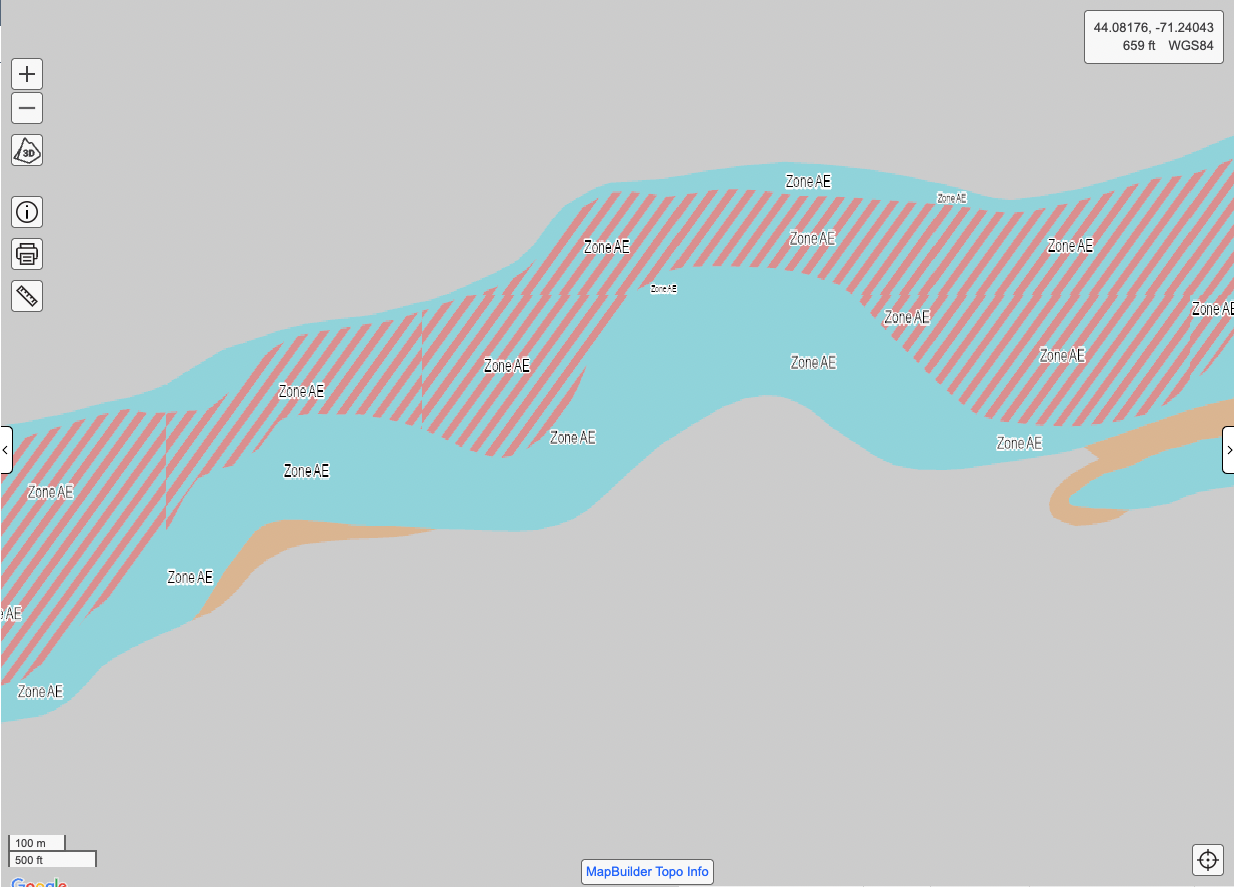
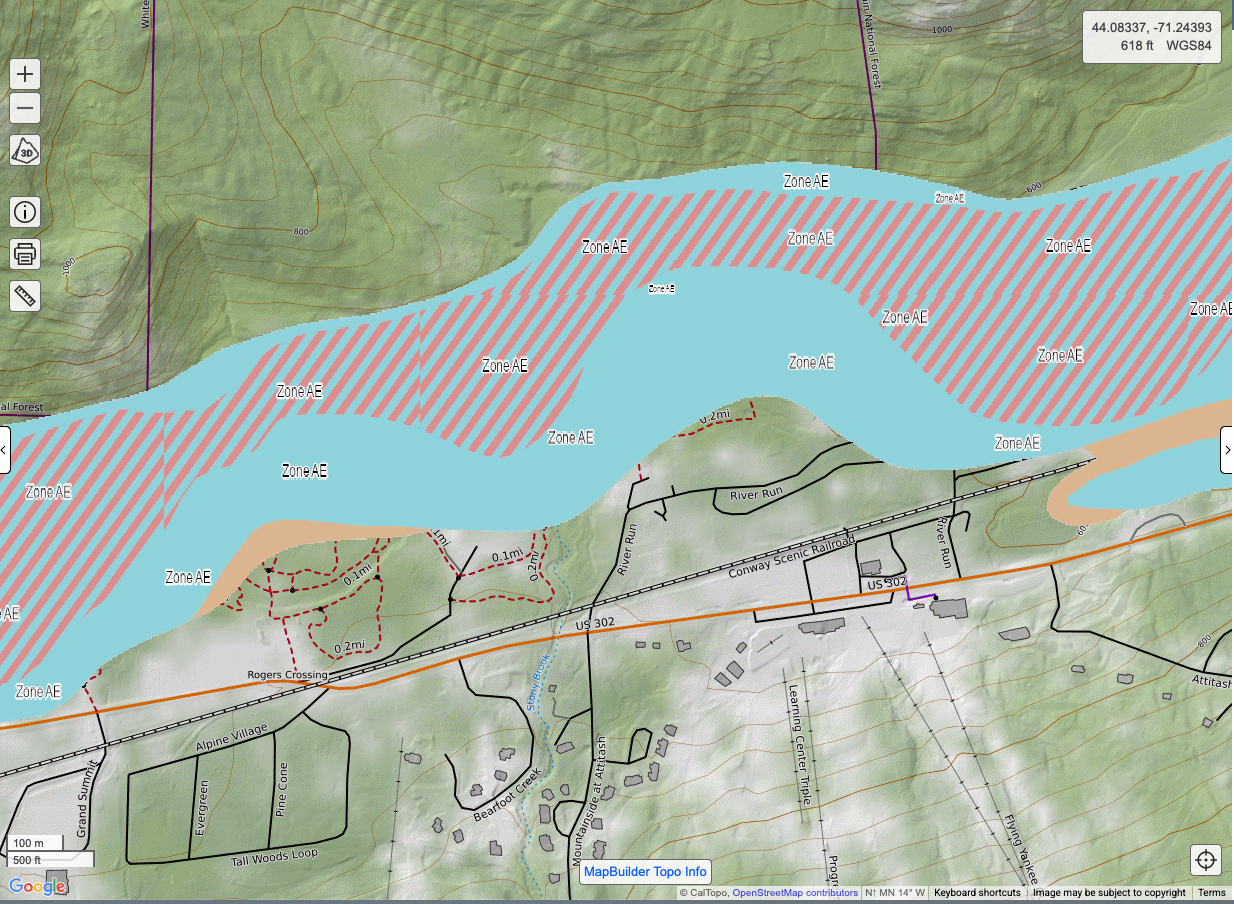
This particular data source works well in CalTopo as a layer because you can adjust opacity to view features like water bodies underneath. In some cases, it may be better to display the data as an overlay. If your custom source isn’t displaying as expected, consider changing it from a base layer to an overlay.
While in the edit box, you can also rename the layer. If you like it and plan to use it again, save it to your account using the blue link at the bottom left.
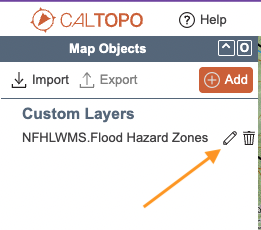
After saving, refresh the page to see it in your layers list. To make further changes, create a new custom source and use the “Load From” feature at the bottom left of the edit box to select and edit your saved layer.
Accessing a Saved Layer
To edit a layer you've saved to your account, use the same custom source edit box. Open a new custom source layer and find the "Load From" dropdown menu in the bottom left.
You’ll see a list of layers saved to your account. Choose one and adjust the settings as needed.
Note – When you save a newly edited layer, it creates a new copy rather than replacing the original. If your intent was to update the original, go to the "Your Layers" section of your account info and delete the old version.
Example 2: British Columbia Aerial Image
Now let's try a different source.
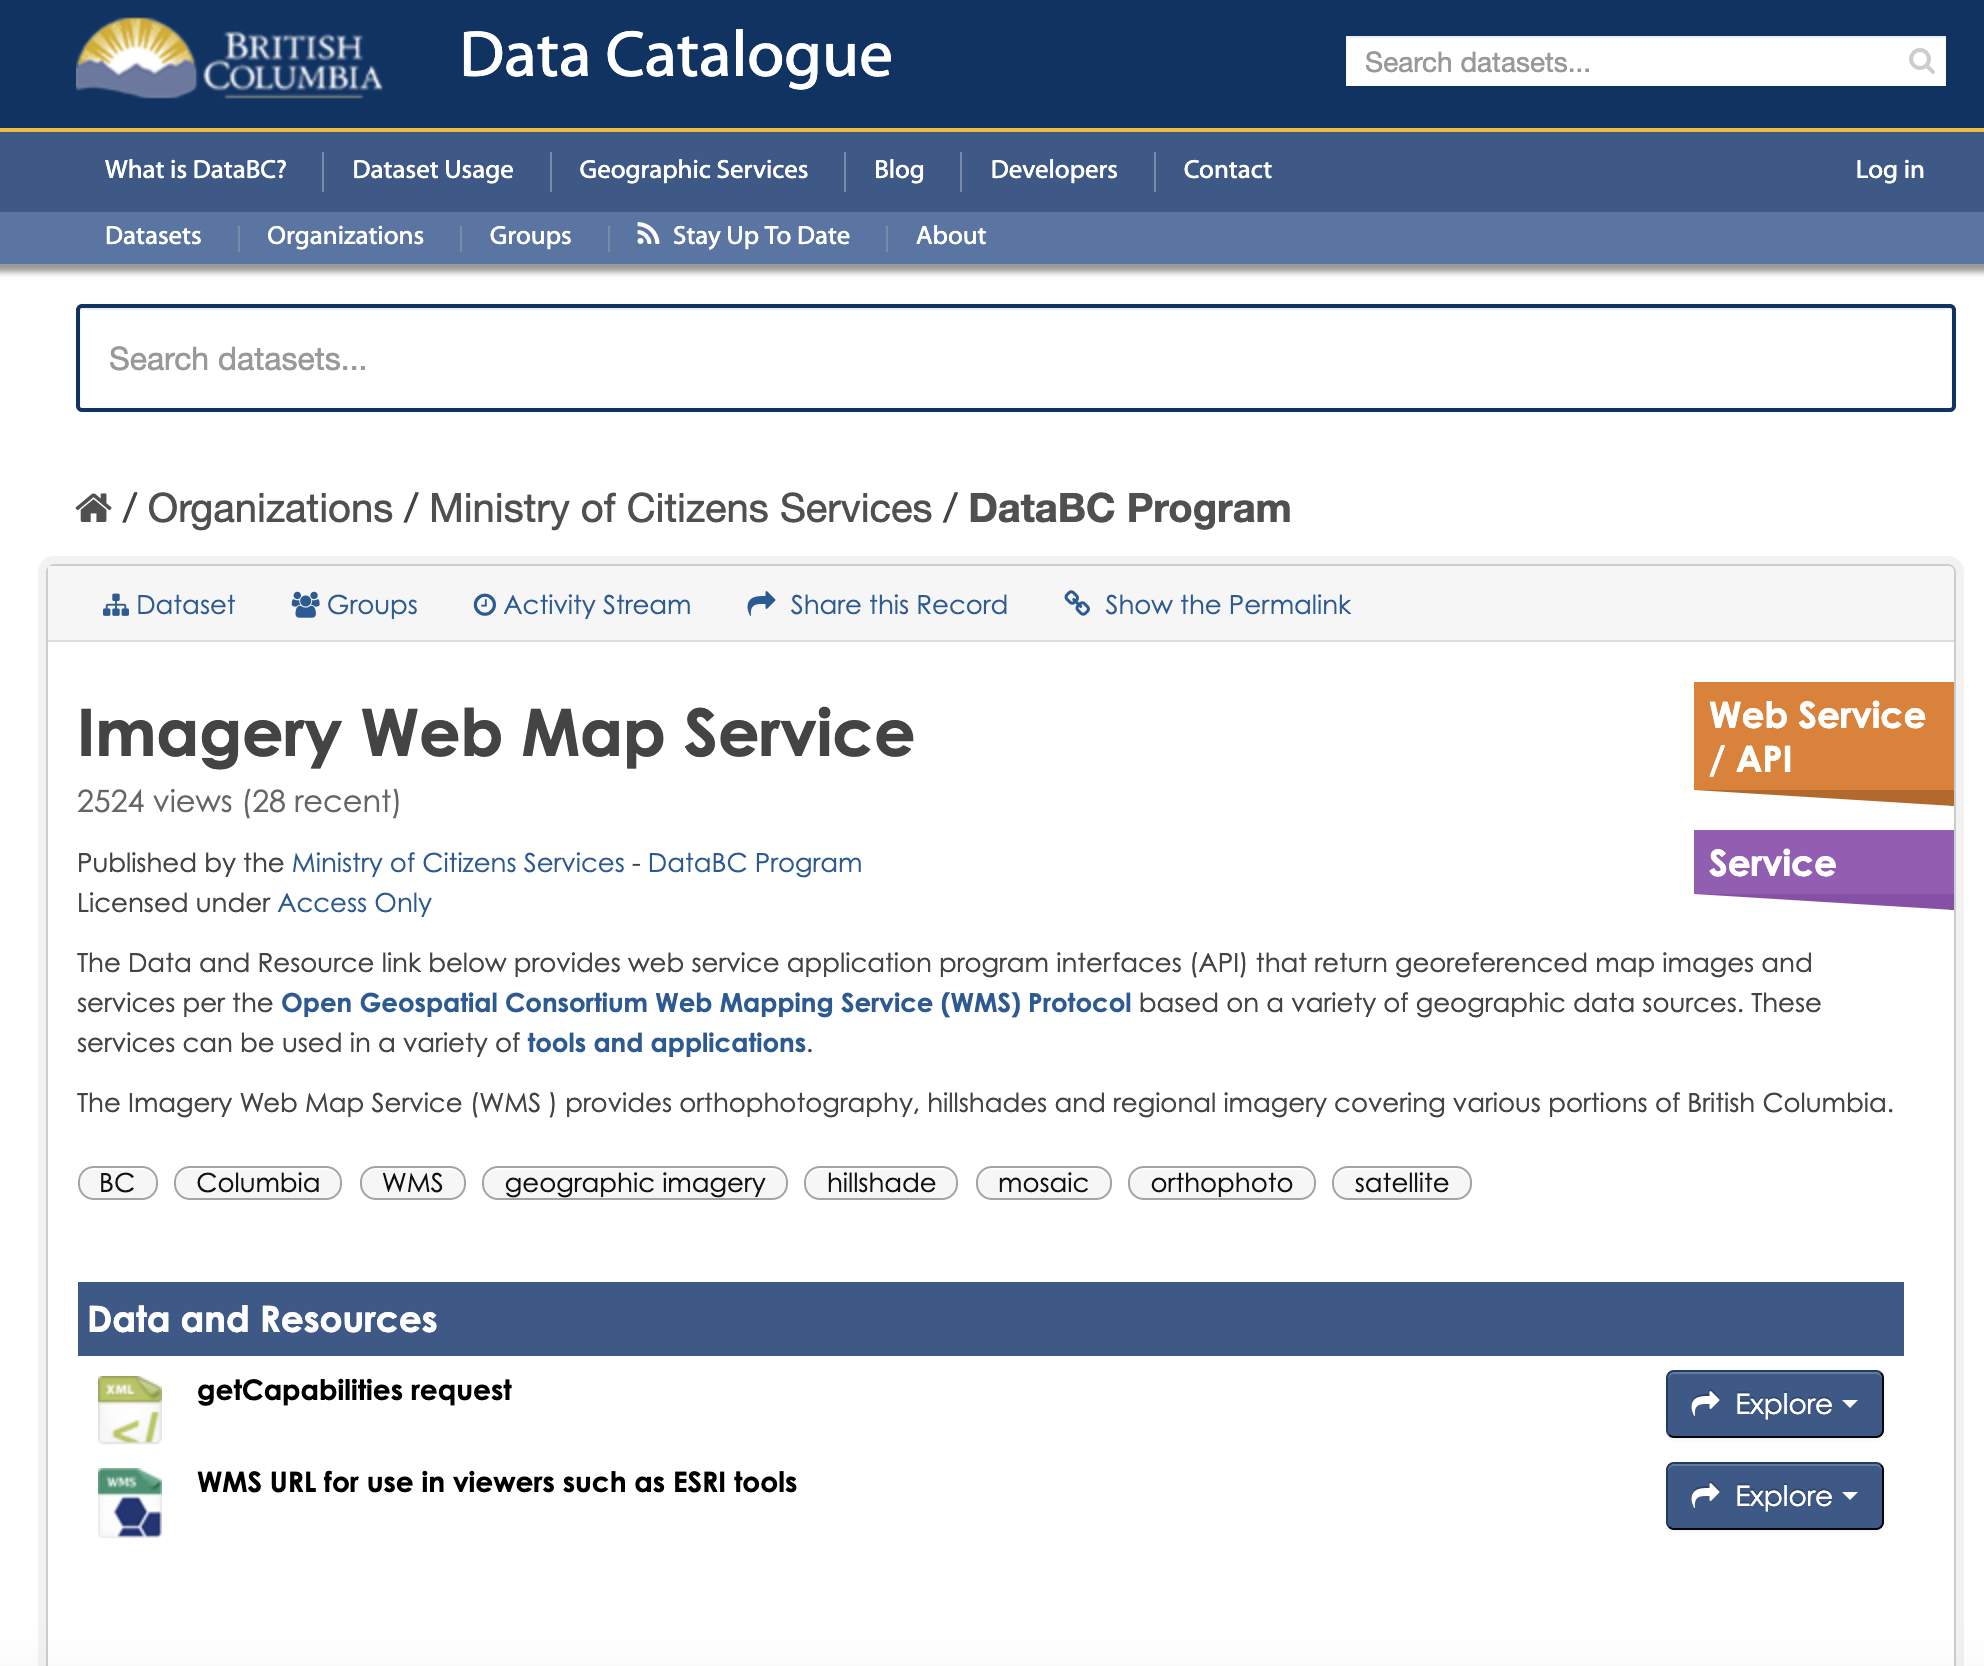
Here is a website that provides access to public map data for the Province of British Columbia in Canada. Following the getCapabilities request link goes to the next page:
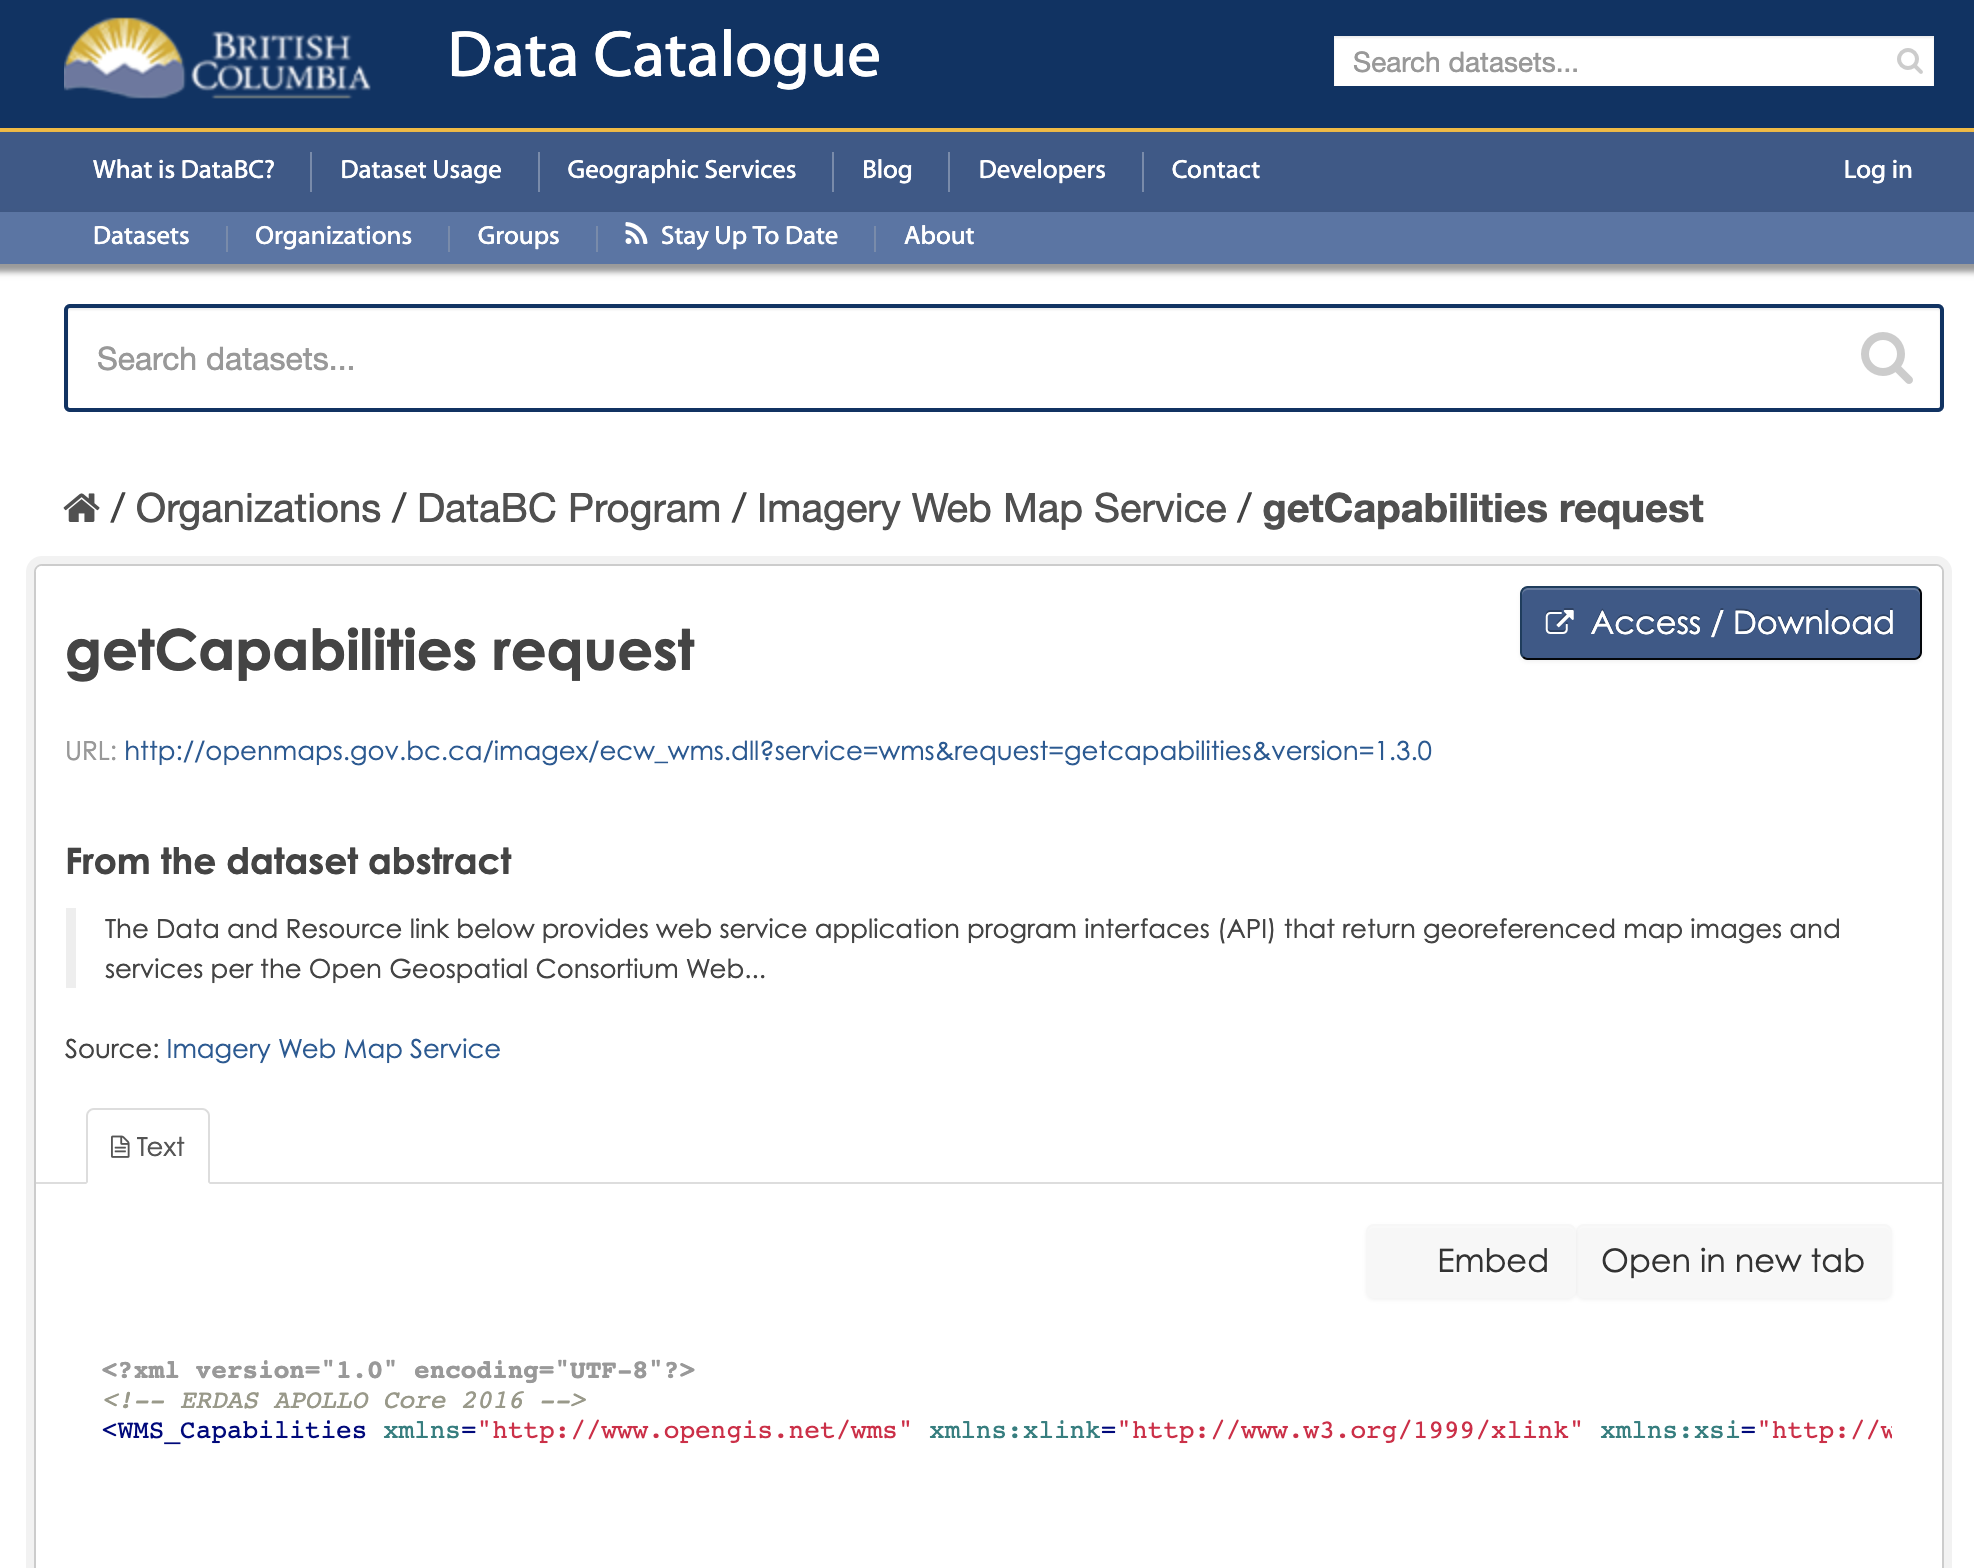
...which does not look like much. But we take the link listed as the URL here, and go back to CalTopo and pop it into the Auto-configure URL input.
Then press GO.
Next we get a long list of potential layers to pull into our new custom source layer. Depending on the map server, sometimes you will want all of the offerings, and sometimes only one. In this case, if we select all of them it’s very messy as these layers are not built to be tiled all into one. Let’s just pick one image - such as for Whistler.
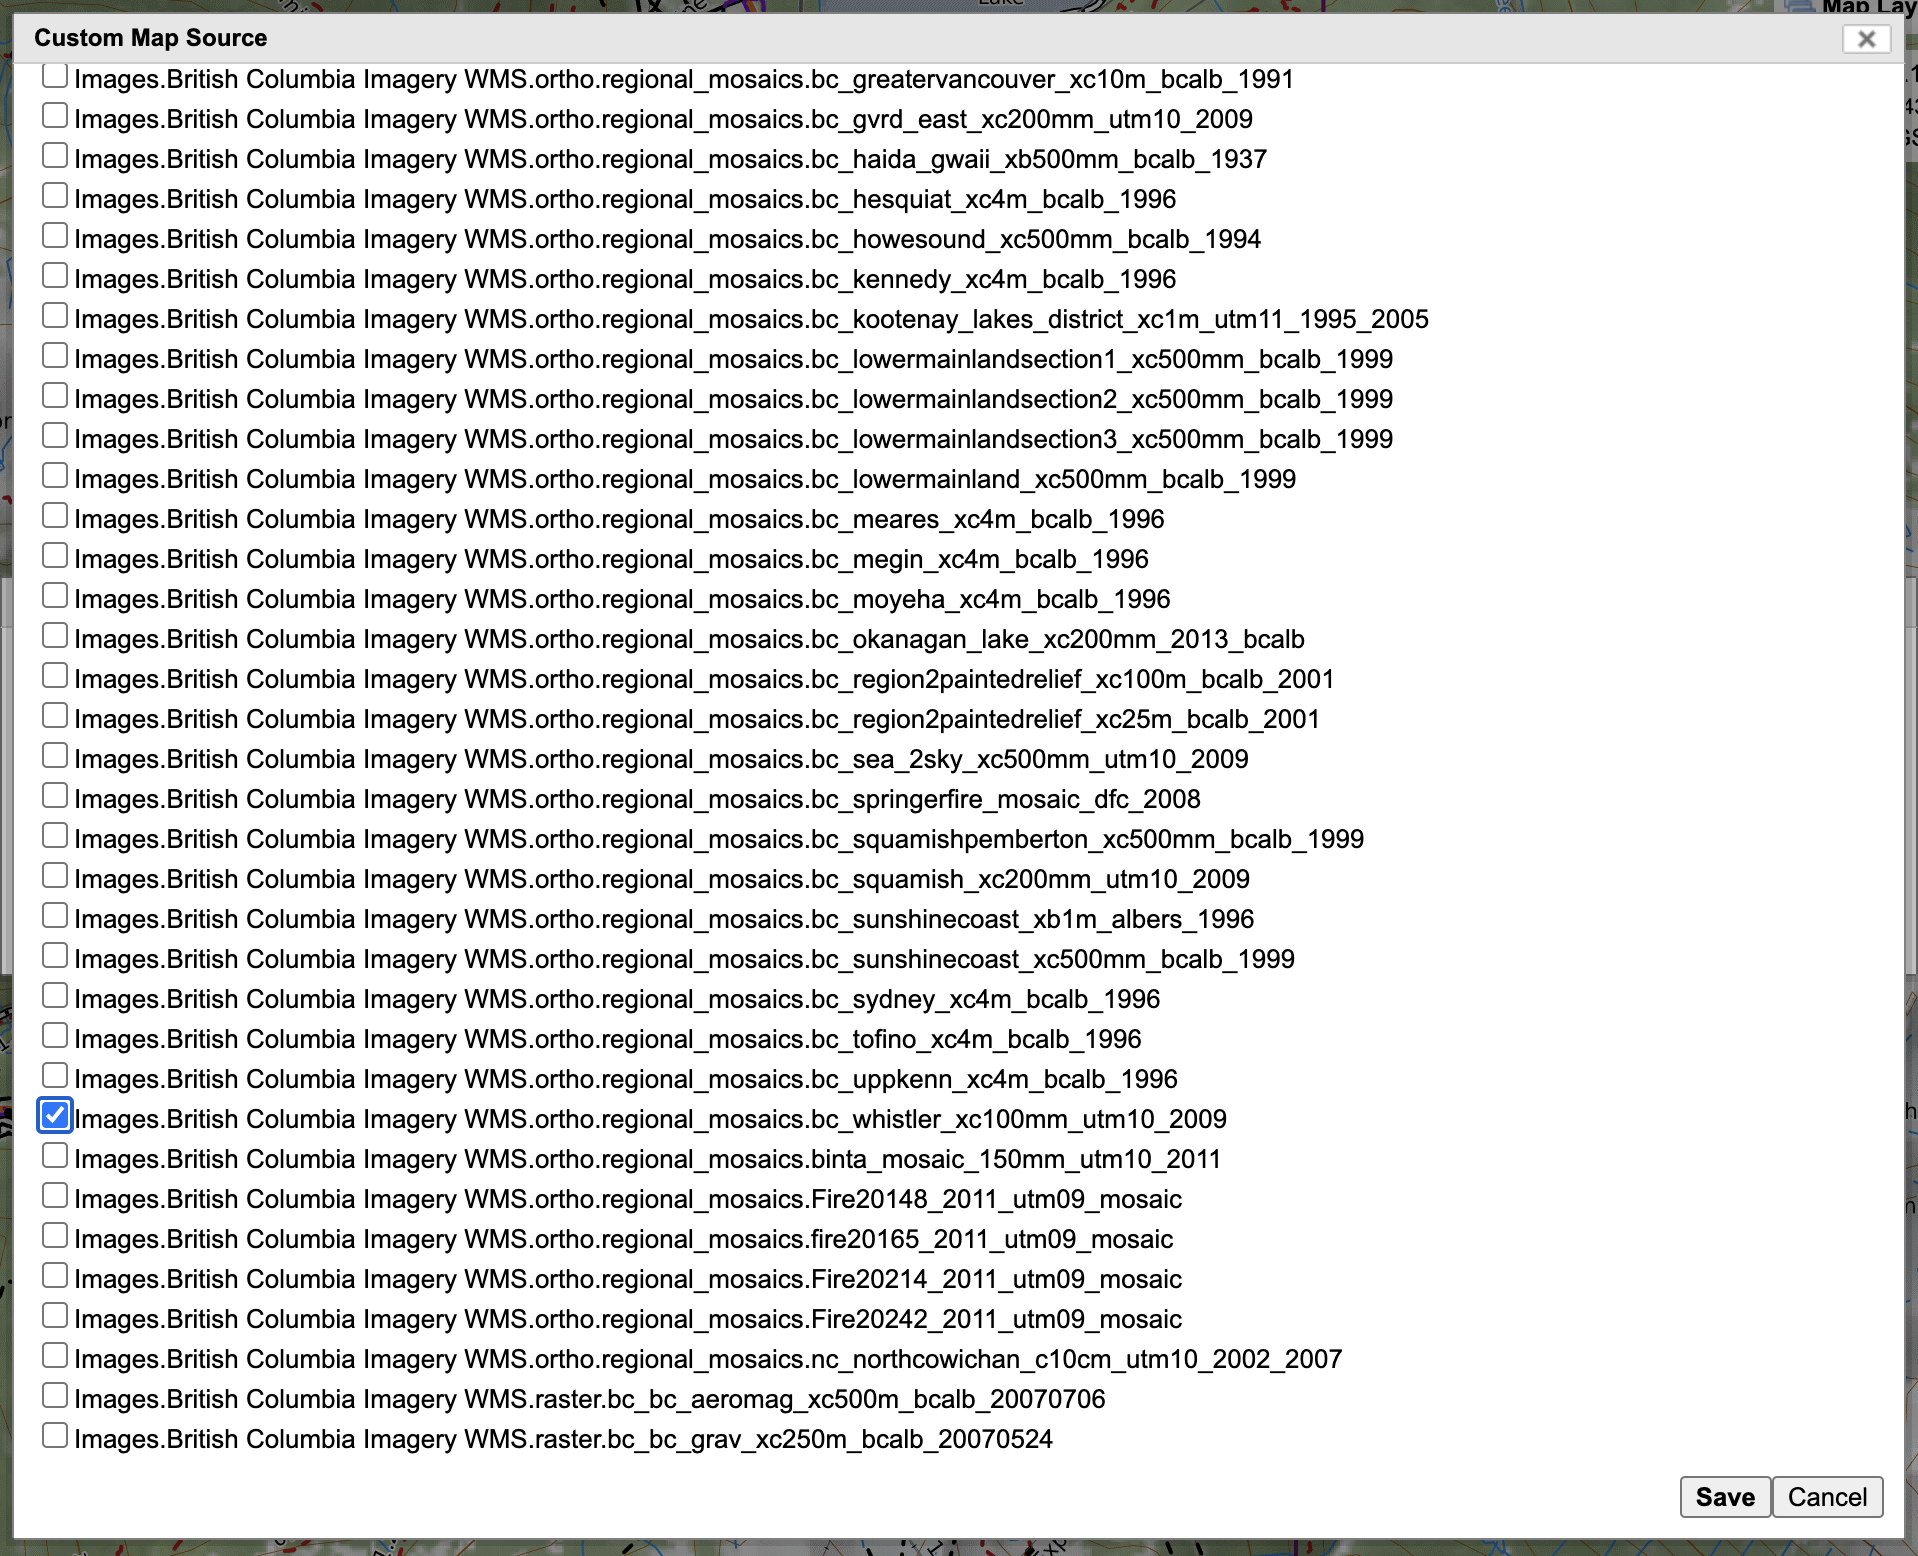
Then I hit save and it goes back to the edit box.
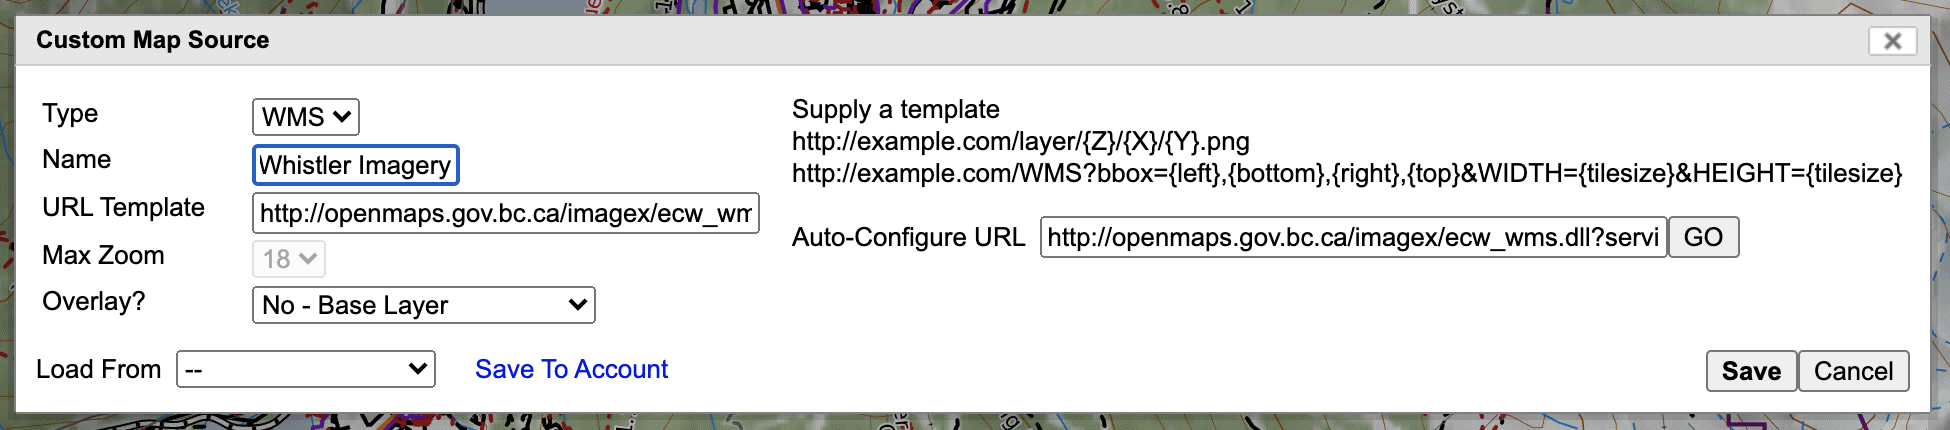
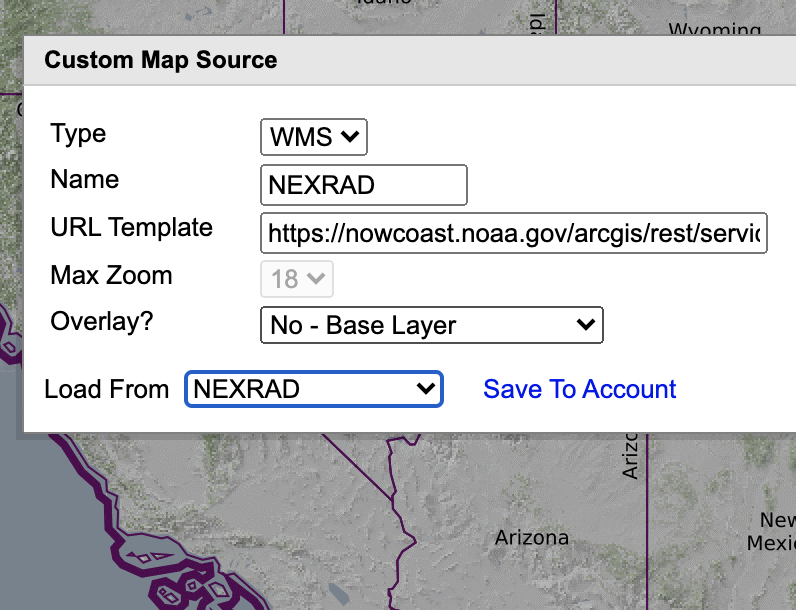
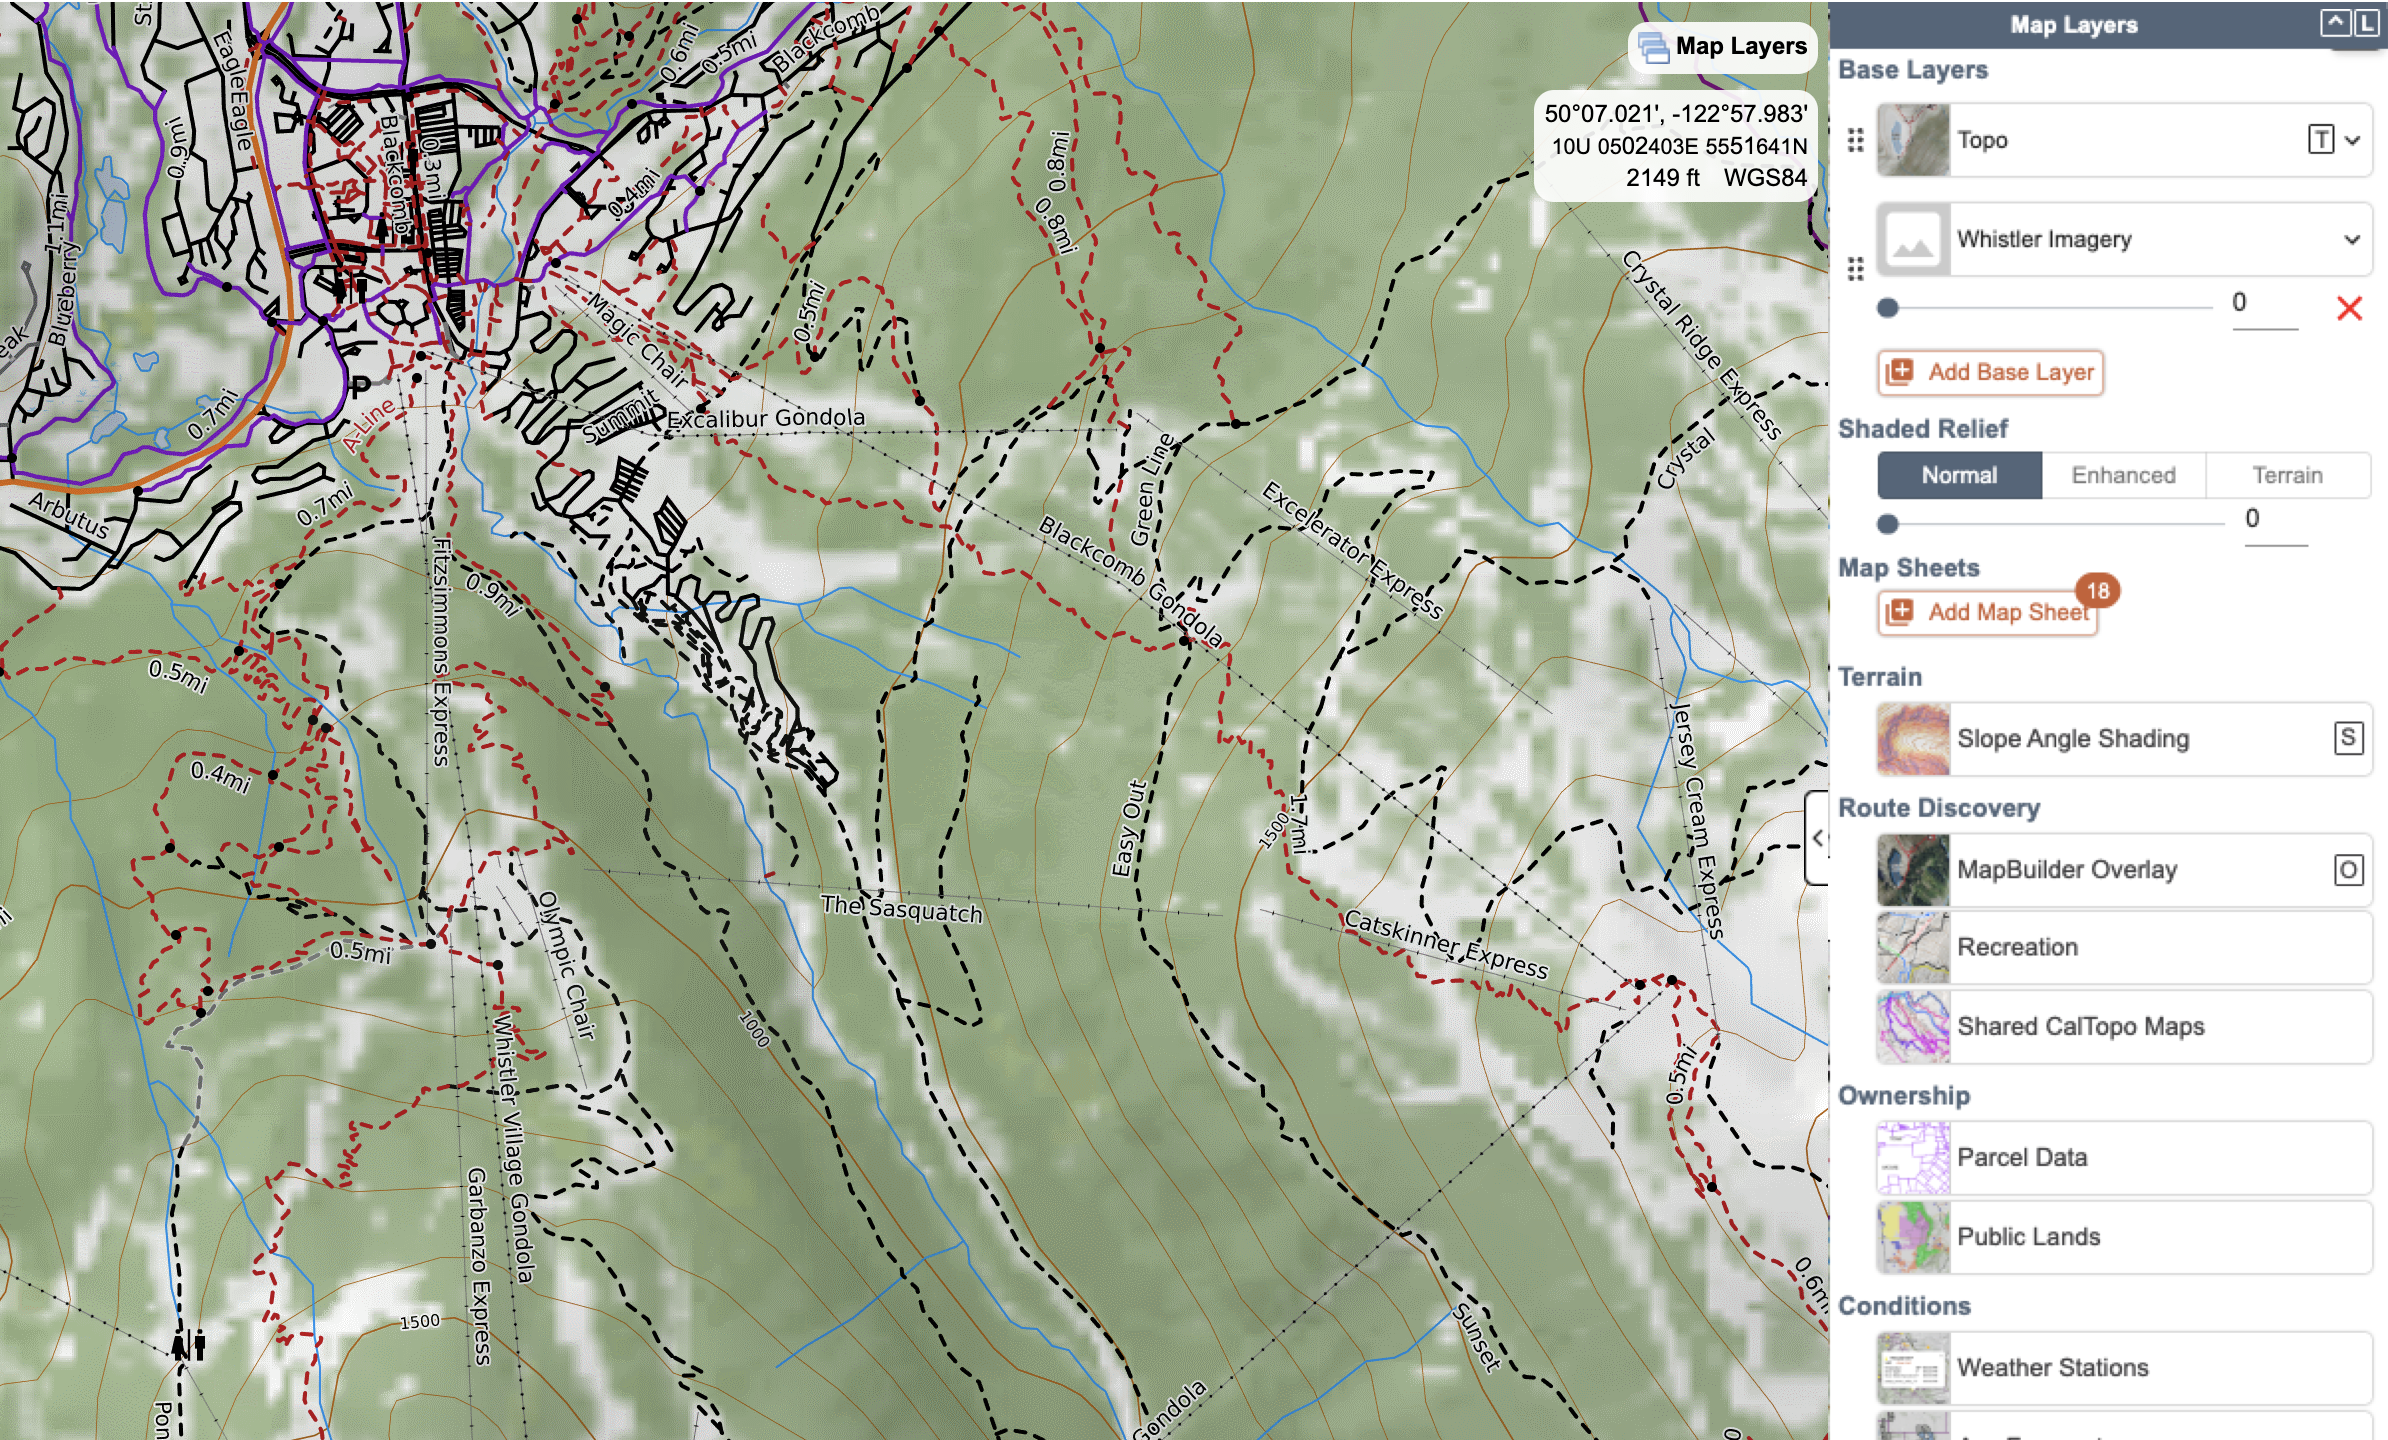
The auto configure figured out that this was a WMS source and changed the Type field from Tile to WMS. It also created a URL template for me. I added a title called “Whistler Imagery.” Then select the save button to display the layer.
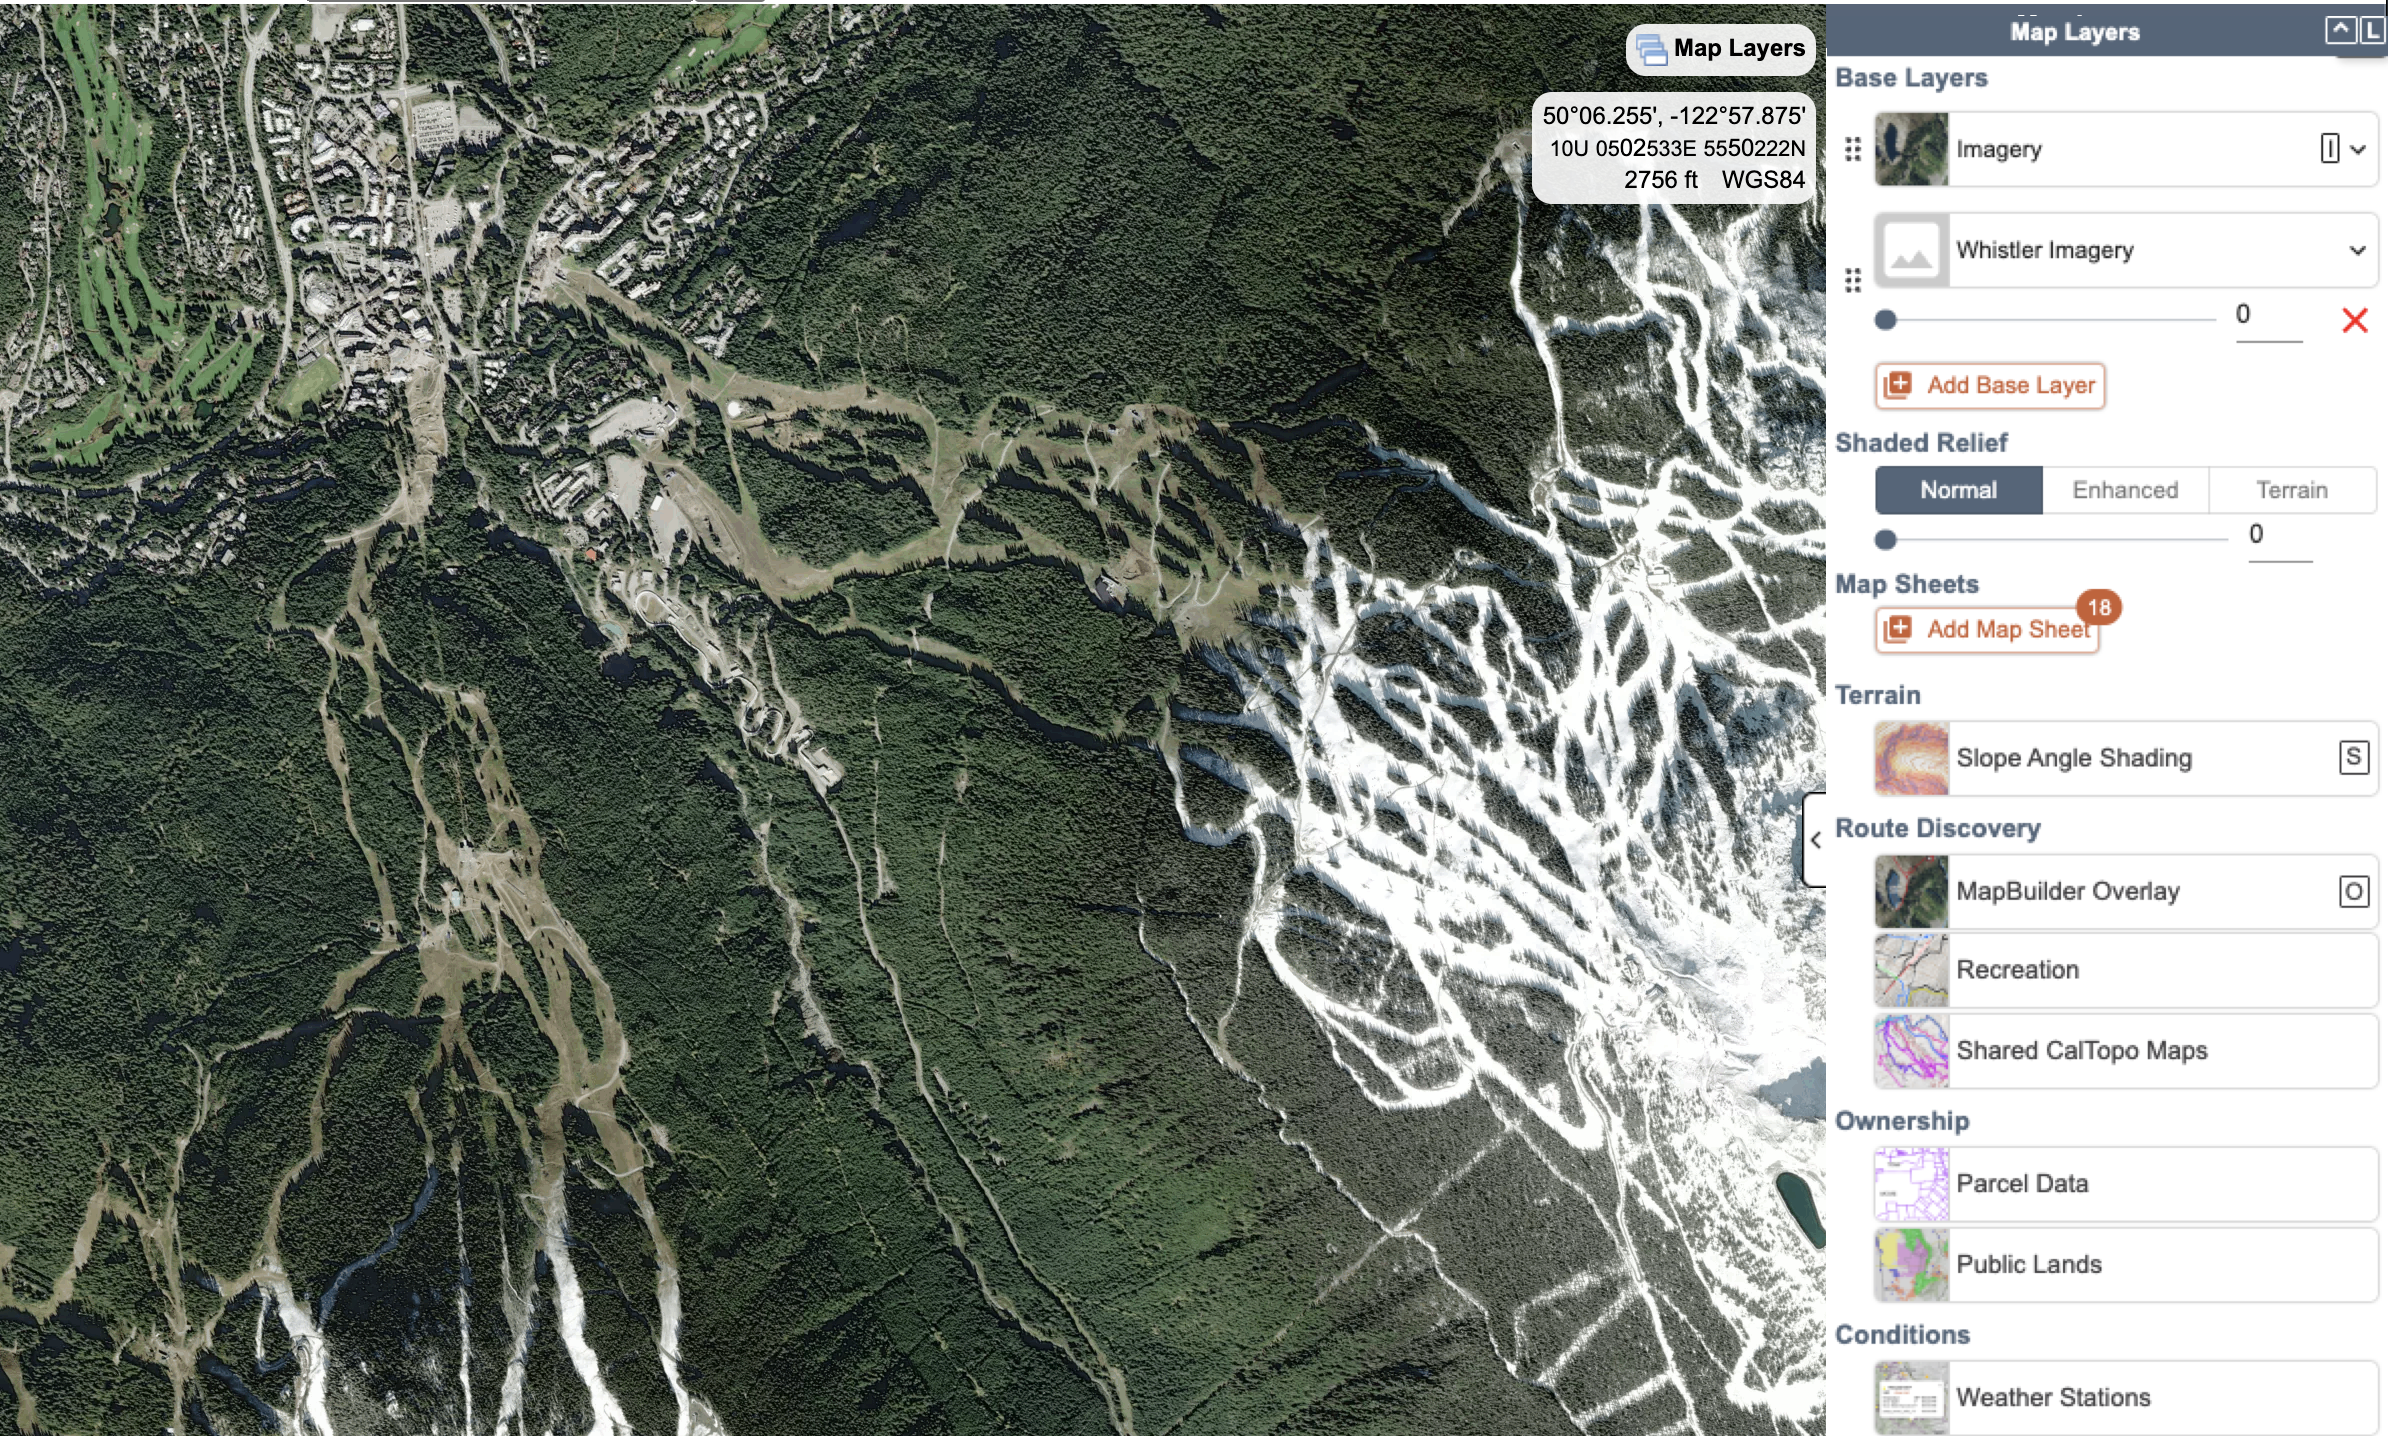
Now here is the imagery layer, and for compassion, the same location with the MapBuilder Topo layer.
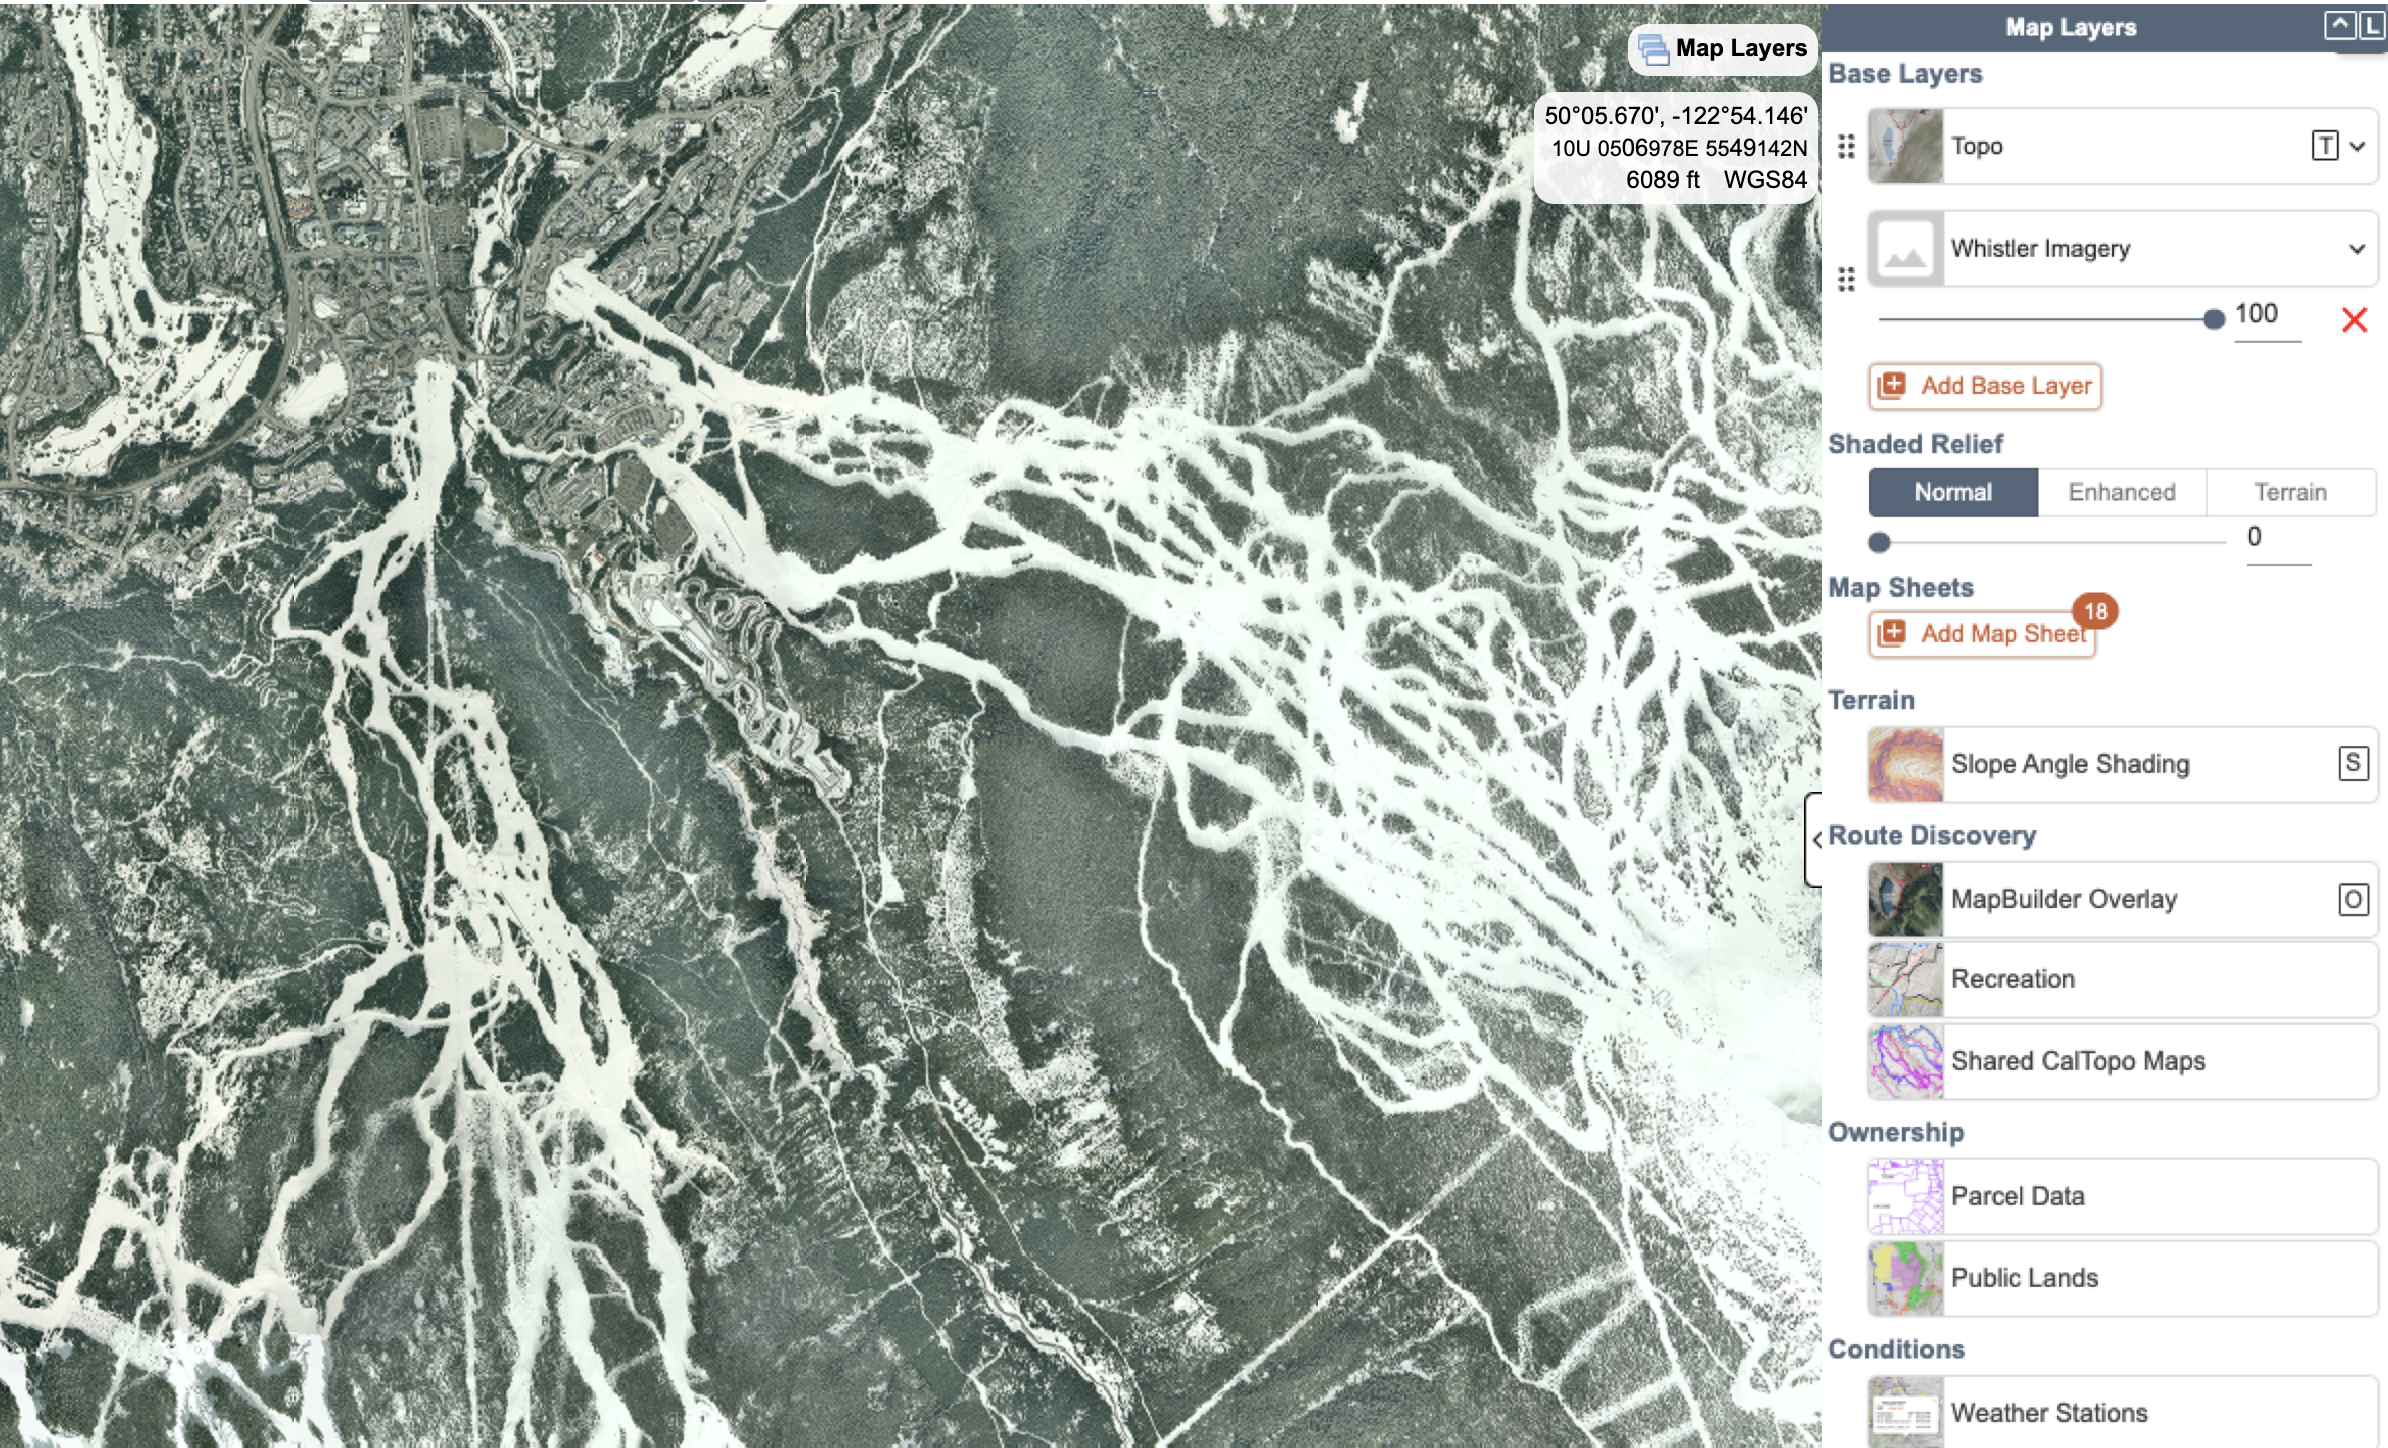
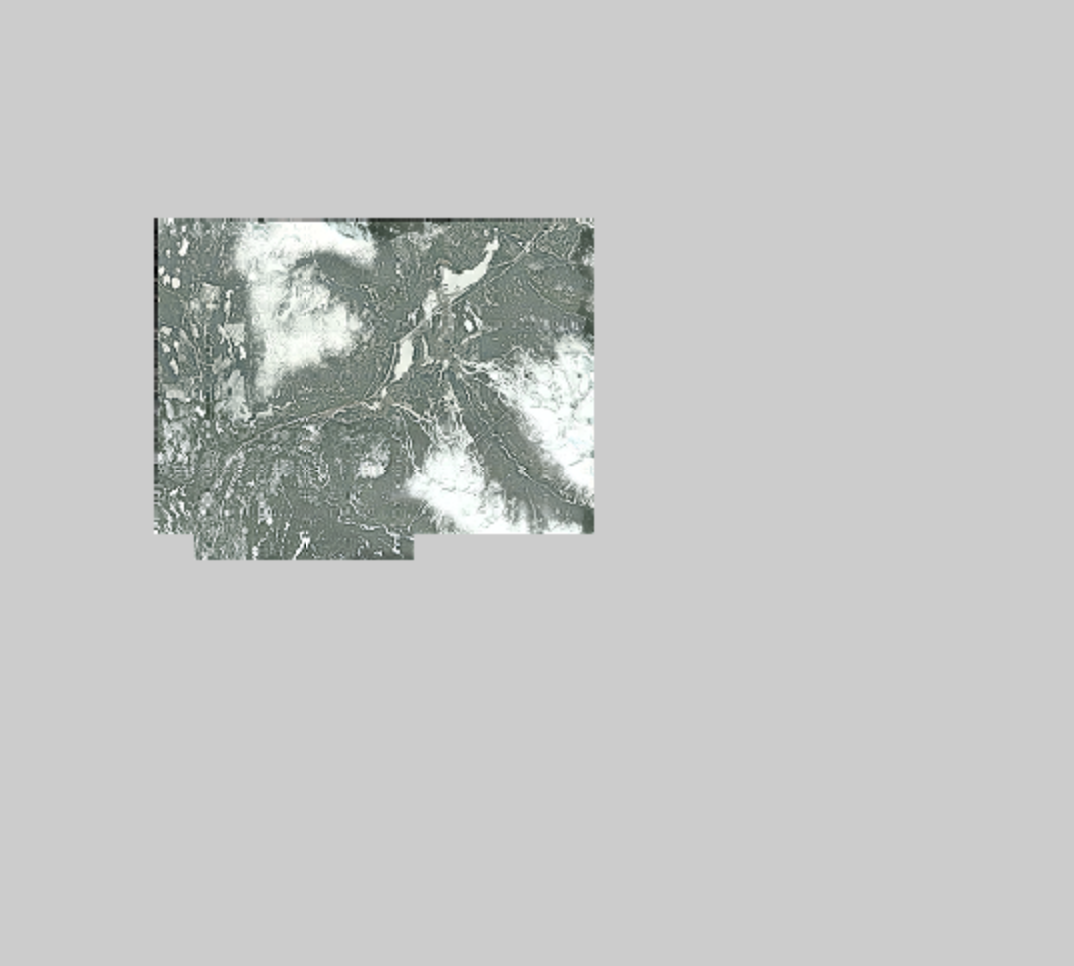
So this image looks great when we are zoomed in quite a lot, but there is a problem as we zoom further out. Setting the custom source layer view at 100% opacity, and zooming out, we can see that this custom source is both geographically limited and the remaining background is all gray in places that the image does not cover. We could try going back and editing the layer to set it as a transparent overlay. However, in this case it remains the same. The gray background persists when set as an overlay, and furthermore we lose the ability to change the layer opacity. (If you are not familiar with layer opacity yet, check out the Using Base Layers lesson).
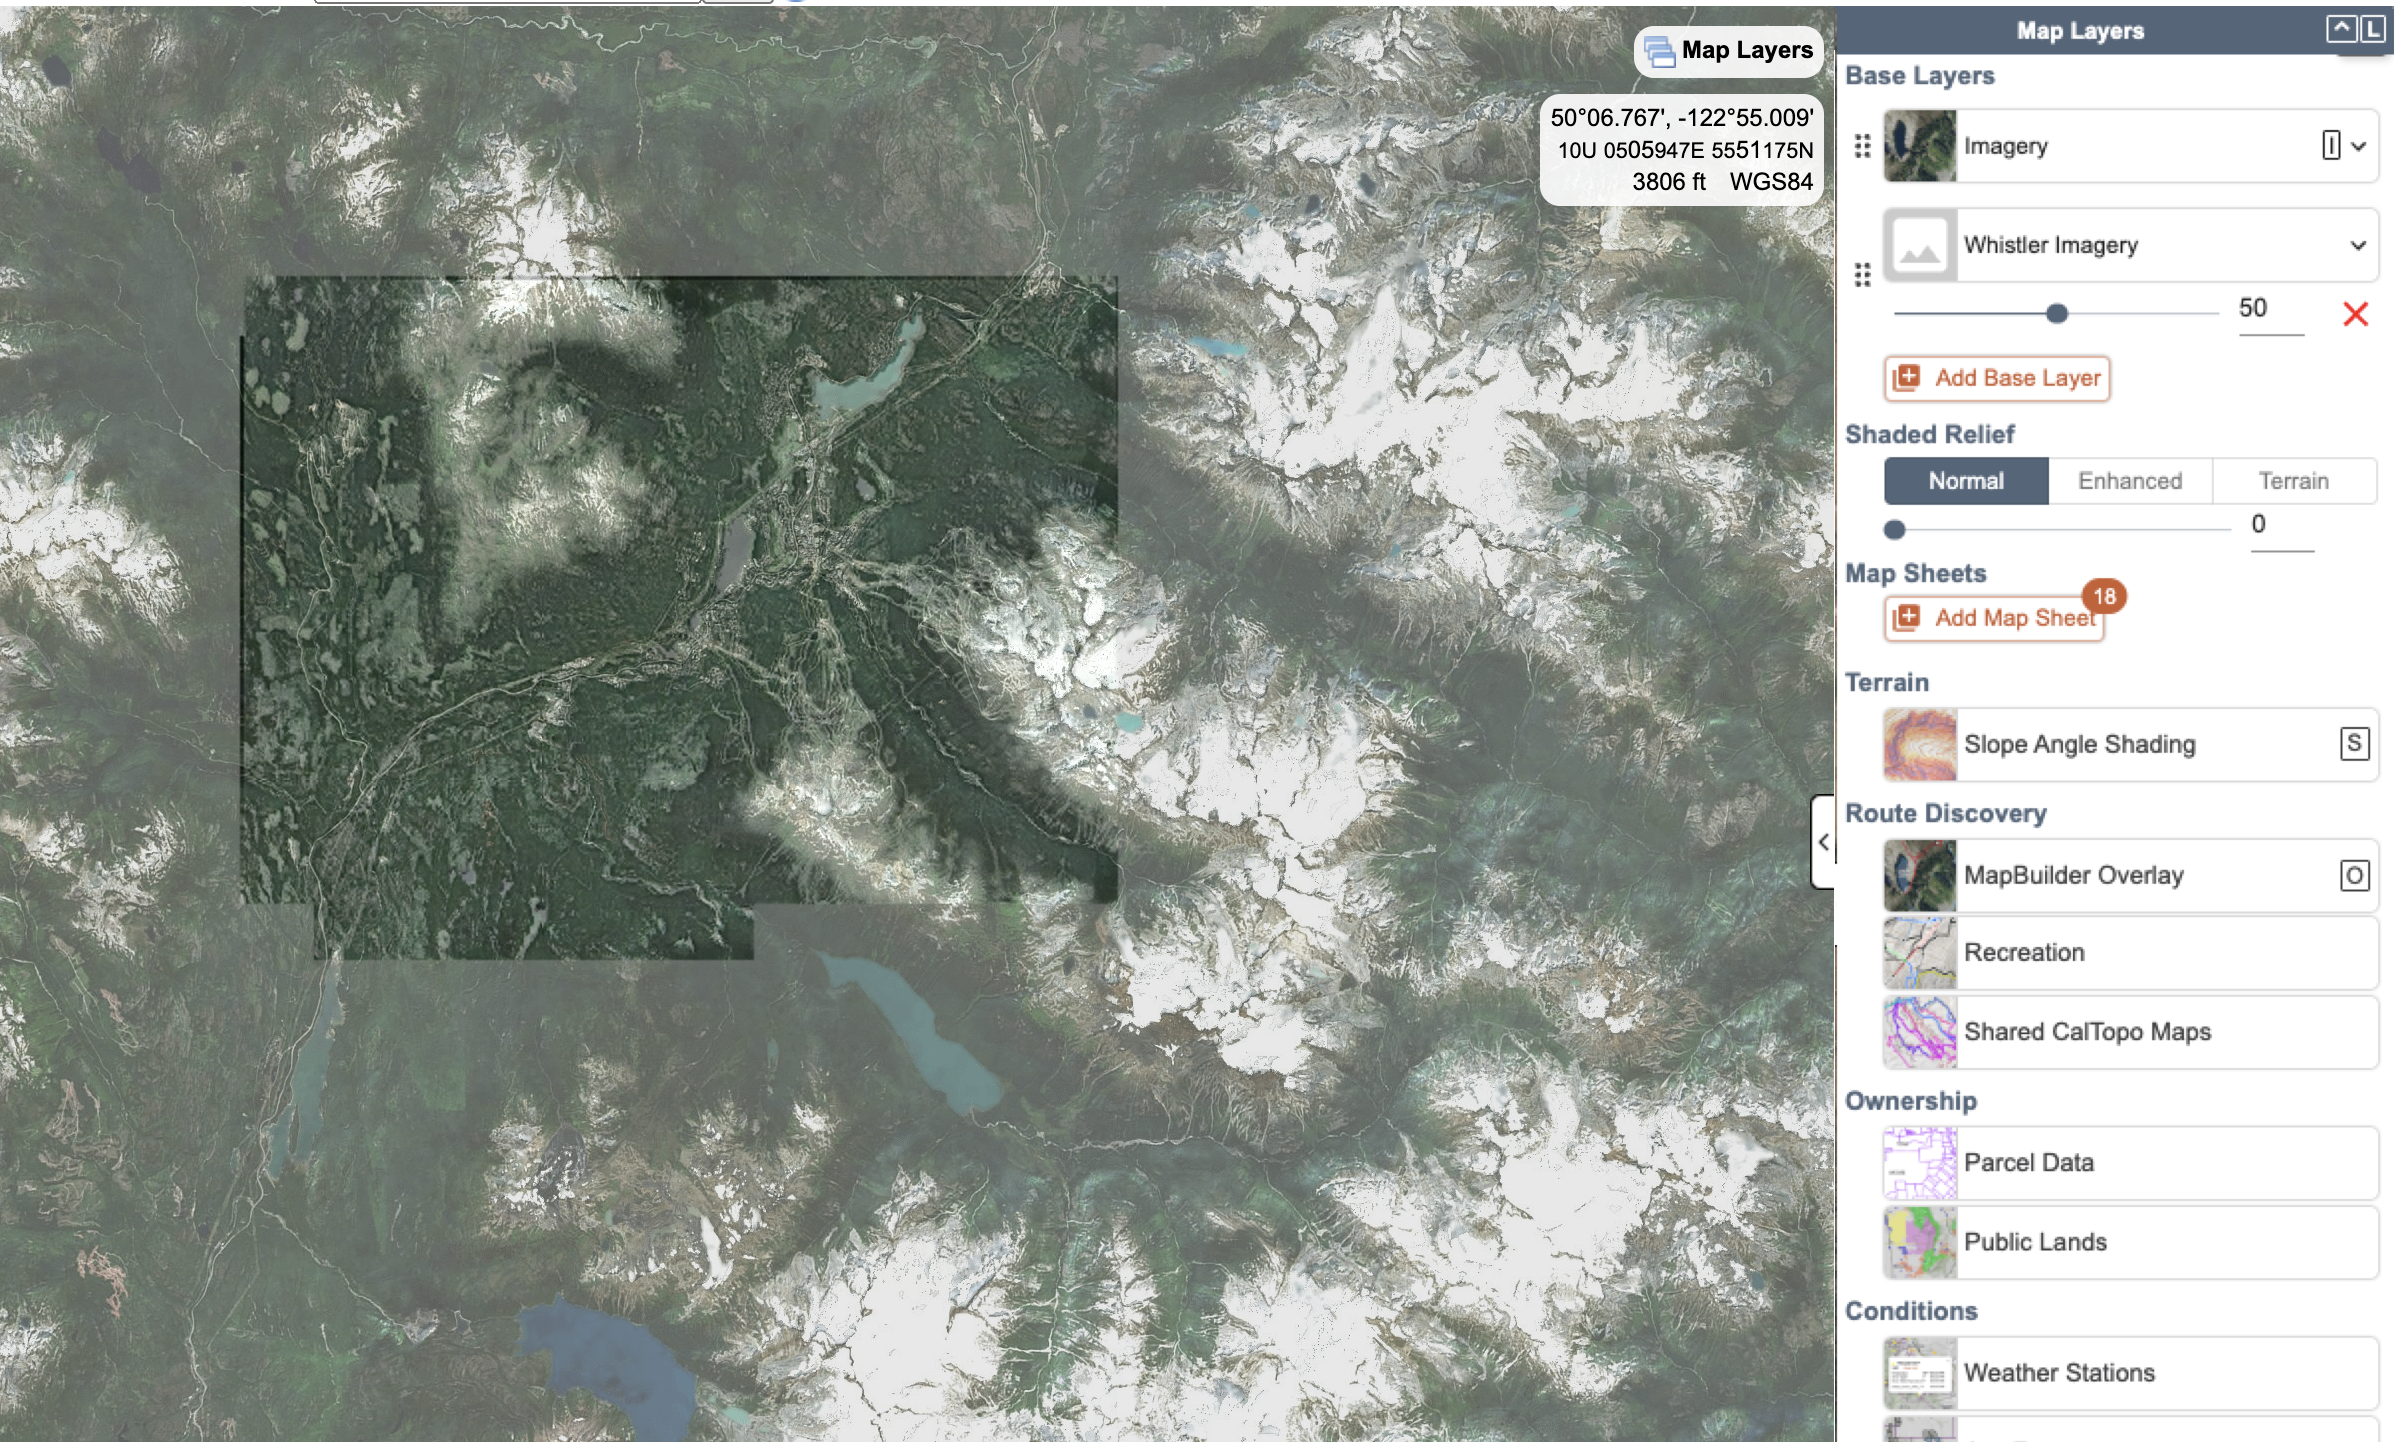
Here the custom source layer is displayed at 45% opacity.
As you can see, custom sources can be fickle. Map servers are not necessarily serving up data that fits into CalTopo’s model of use. They require some digging, creativity, and trial-and-error.