Tips for Using Overlays
in this lesson
Here we cover some additonal details about using overlays that are important to know.
Topics on this Page:
- Zoom Level affects how overlays display.
- Base Layers can make an overlay more or less useful.
- Using Multiple Overlays at once can be helpful or a hindrance.
Zoom Level
Zoom level can have a significant effect on how well an overlay displays or how much power it takes to display it. Your browser may “hang” if you are zoomed out really far and it has to try to gather, calculate, and display a large amount of data. The program will seem like it has stopped working, when in fact it is just overwhelmed and needs time.
For example, trying to view the continental United States with the RealTime Weather Stations overlay turned on will flood your map with black dots and labels, resulting in slow load time and inability to use the map.
Another example is the Sun Exposure overlay, which has to calculate the display based on the time and date you input. The larger the geographical area that it needs to calculate, the longer it will take, and any time you pan the map it has to calculate the areas to fill in after the pan.
Turn extra overlays off when you don’t need them, or before moving the map a long distance.
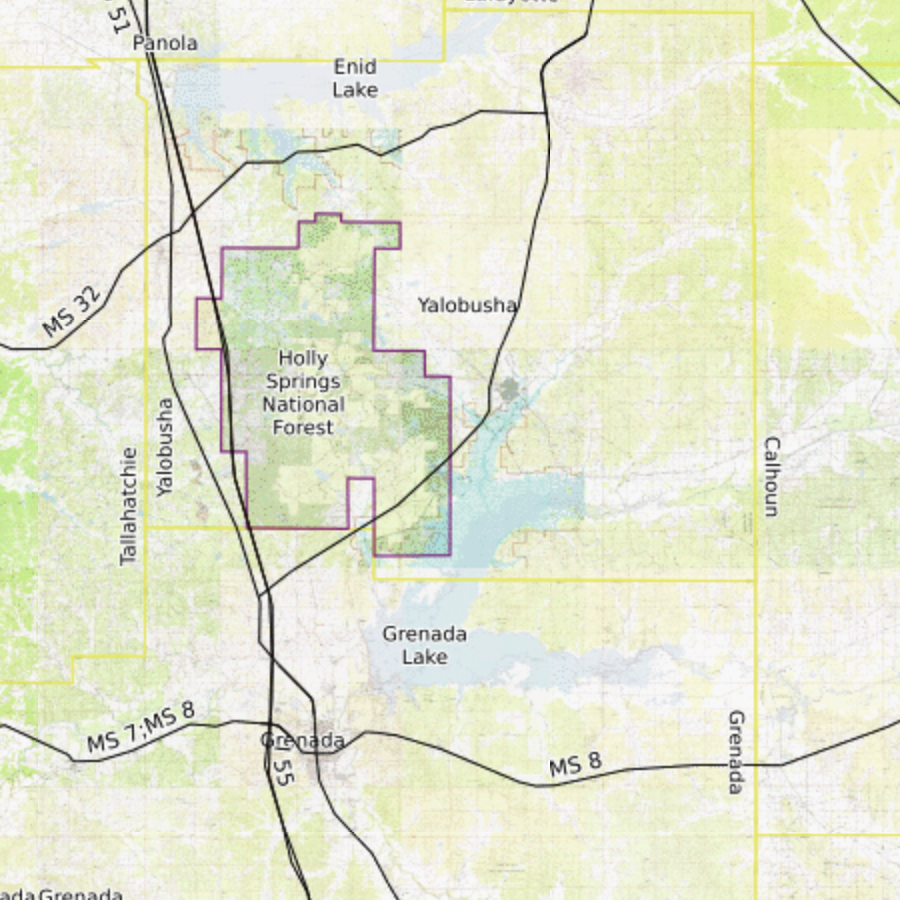
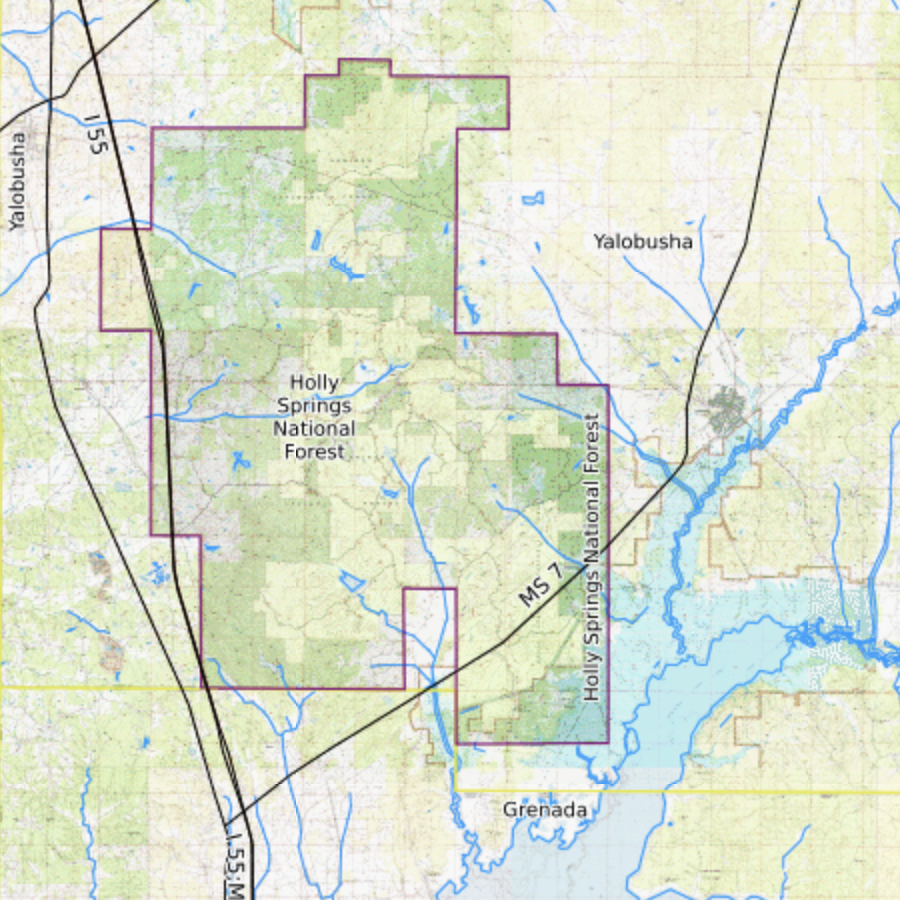
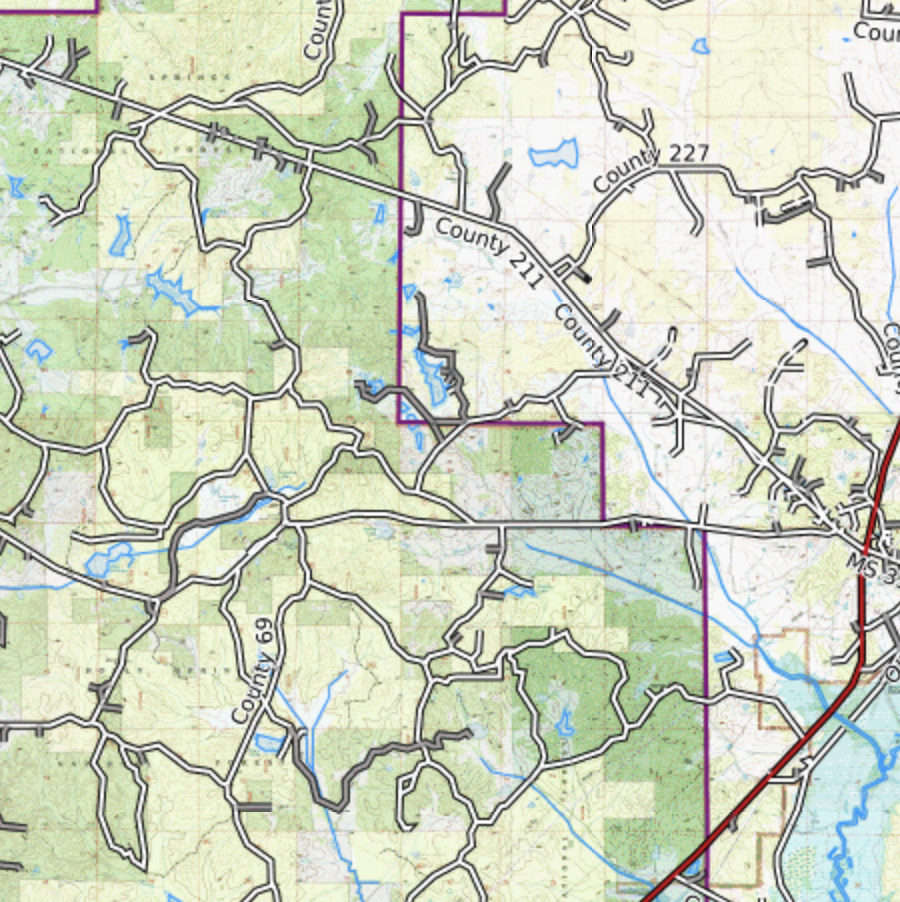
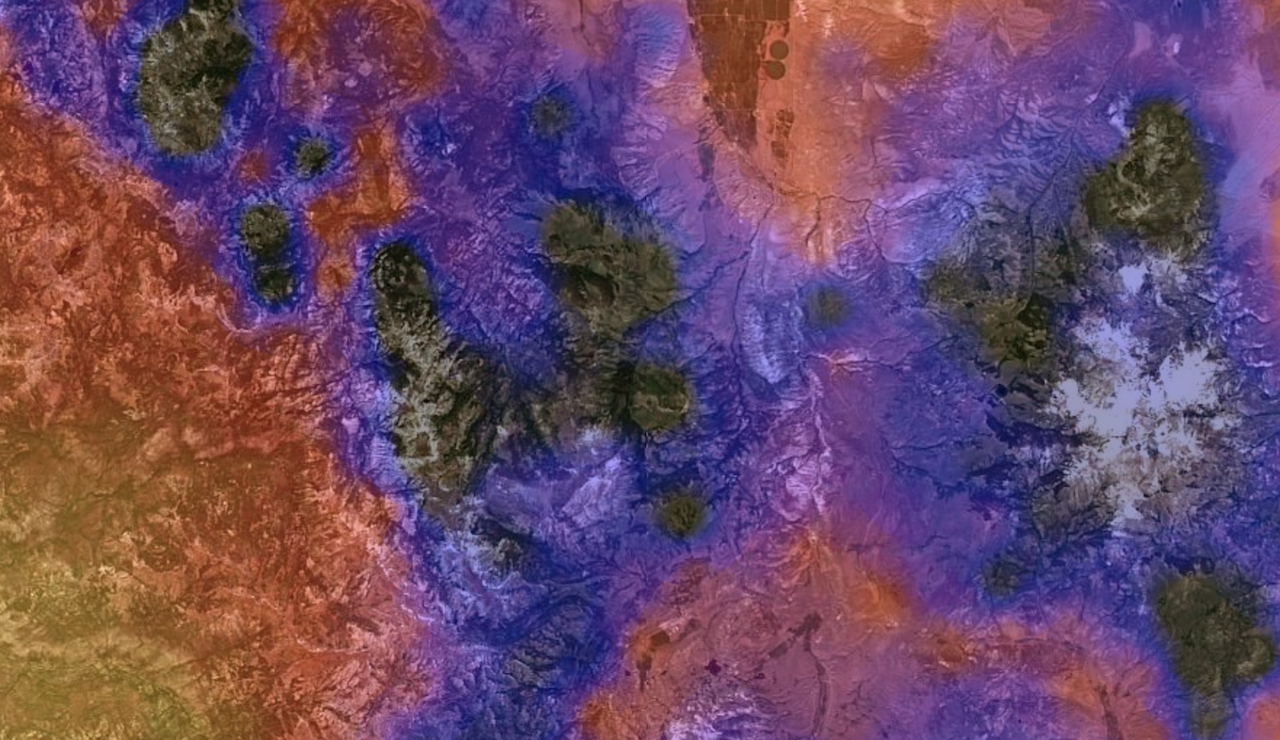
Change your Base Layer
As you can see in the example images that go with the individual overlay descriptions, some overlays might pair better with different base layers than others.
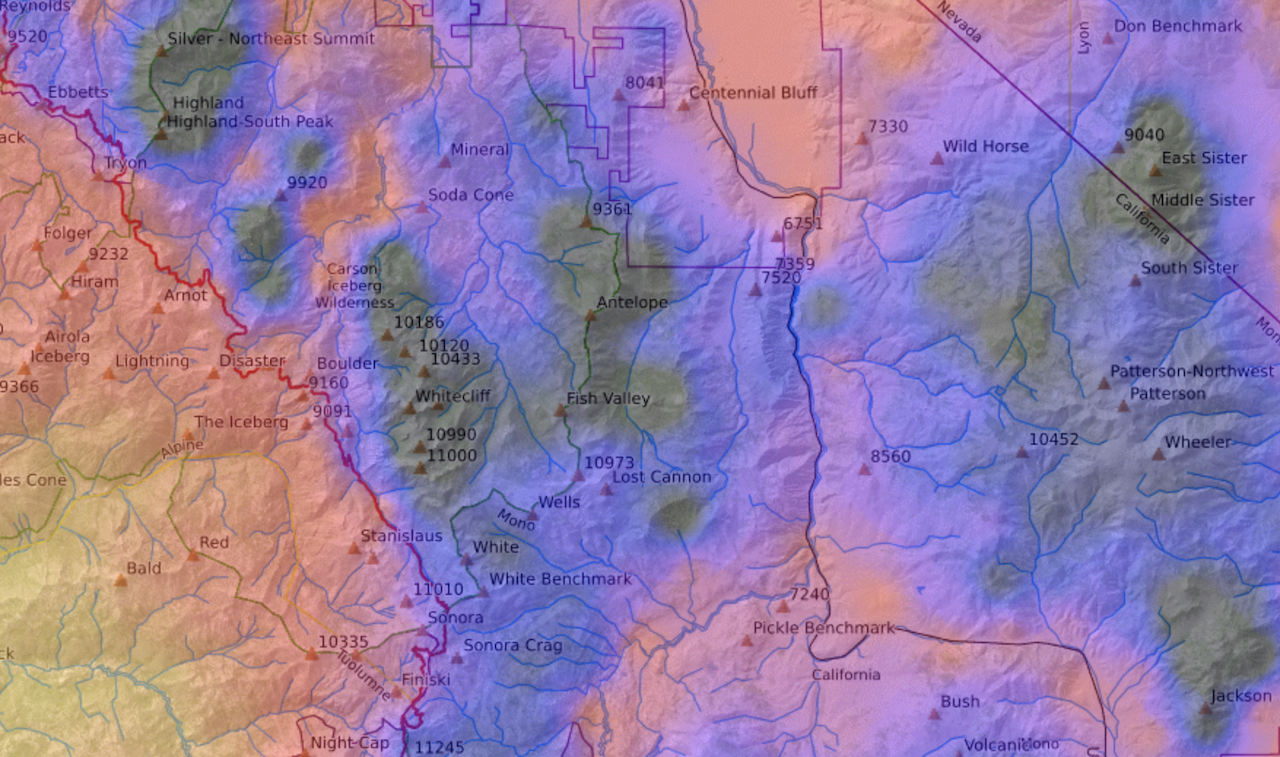
For example, the Color Visualization overlay under the weather forecast section might be hard to view over a satellite image and works better over a lighter background. On the other hand, Parcel Data might be more useful over a satellite base layer rather than a topographical map. Try different combinations to see what gives you the best way to read the data.
Working with Multiple Overlays
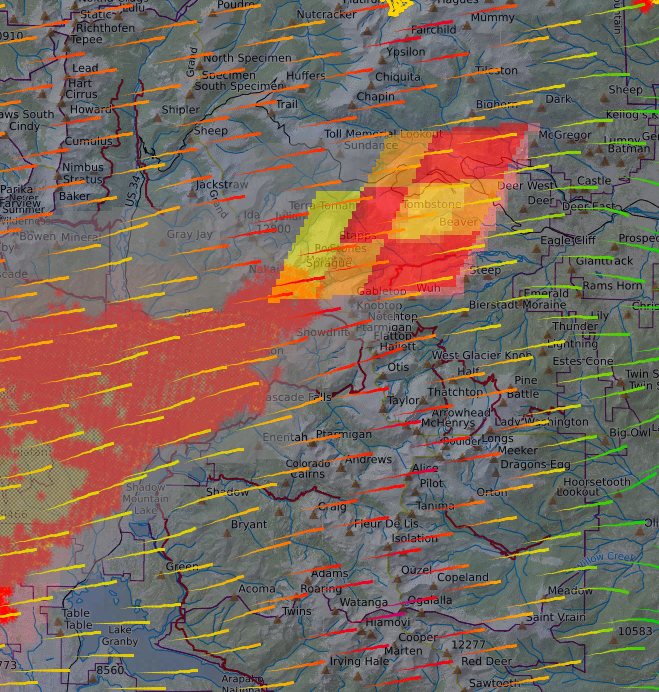
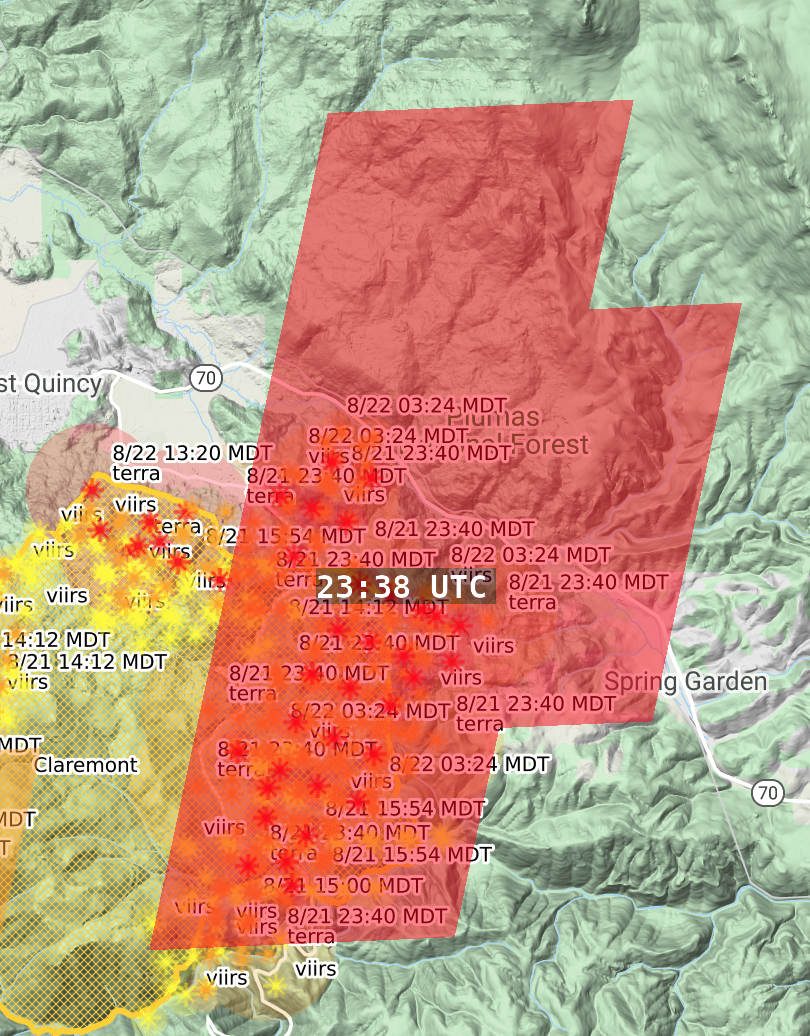
It is possible to activate any combination of overlays at the same time, though you will see a decreasing return on the effectiveness of using each as you add additional overlays to the map. Still, there are times when using a few together make a lot of sense. A great use case for this is wildfire. A user may want to view fire history, activity, live detection, and wind plot all at once. These four overlays combined provide an analysis of the current and future fire behavior. The user can view where the hottest fire sections are and have been recently, how strong the winds are that are fueling the fire and how fast those winds are moving, and if recent fire scars may slow the progress.
Another use case might be using parcel data and public lands overlays together. Yet another case could be using the MapBuilder overlay in combination with the MVUM overlay and Contours on top of a satellite base map.