Risk Evaluation and Safety
in this lesson
Whether an incident is quickly resolved during the hasty search or continues through multiple operational periods, team safety will be an ongoing concern. Throughout the mission, you continually build, reference, and refine your safety plan. CalTopo can help you gather information to support your risk assessment and plan.
The safety assessment for your mission may seek to determine answers to the following questions, among others:
- What are the current conditions like, both on the ground and with the weather?
- Do we need special resources or equipment based on the conditions?
- What hazards are present that you need to consider and how can they be mitigated?
- Where are your ingress and egress options?
- What is the plan for an incident-within-the-incident (IWI)?
By the end of this chapter, you should be able to do the following:
Hazard Assessment
In the previous chapter we looked at how different base layers and overlays could be used to gather a variety of information. While you are analyzing those layers, you should be looking for potential areas of higher risk. These could include cliffs and rockfall hazard zones, avalanche zones, high traffic areas (for urban searches), steep talus fields, ice, crevasses, confusing braided trails, variations between map sources, old mines shafts or caves, wetlands, slot canyons, private property, and much, much more. Comparing and integrating different base layers and overlays can help you to spot these hazards.
As you use base layers and overlays to identify potential hazards in your search area, it can be a good practice to add map objects to call out these dangerous areas on the map. This can be used to inform your search planning by identifying particular areas that the missing party may have encountered trouble as well as alerting your field teams to specific dangers.
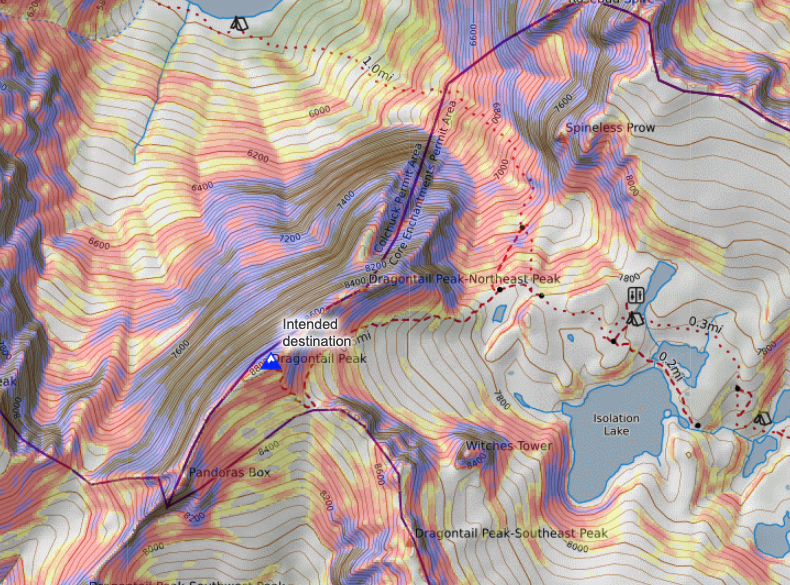
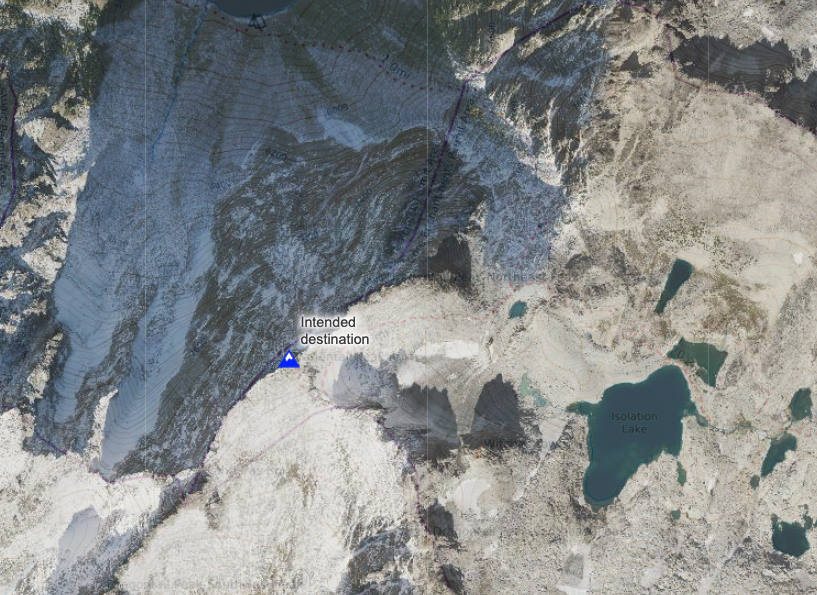
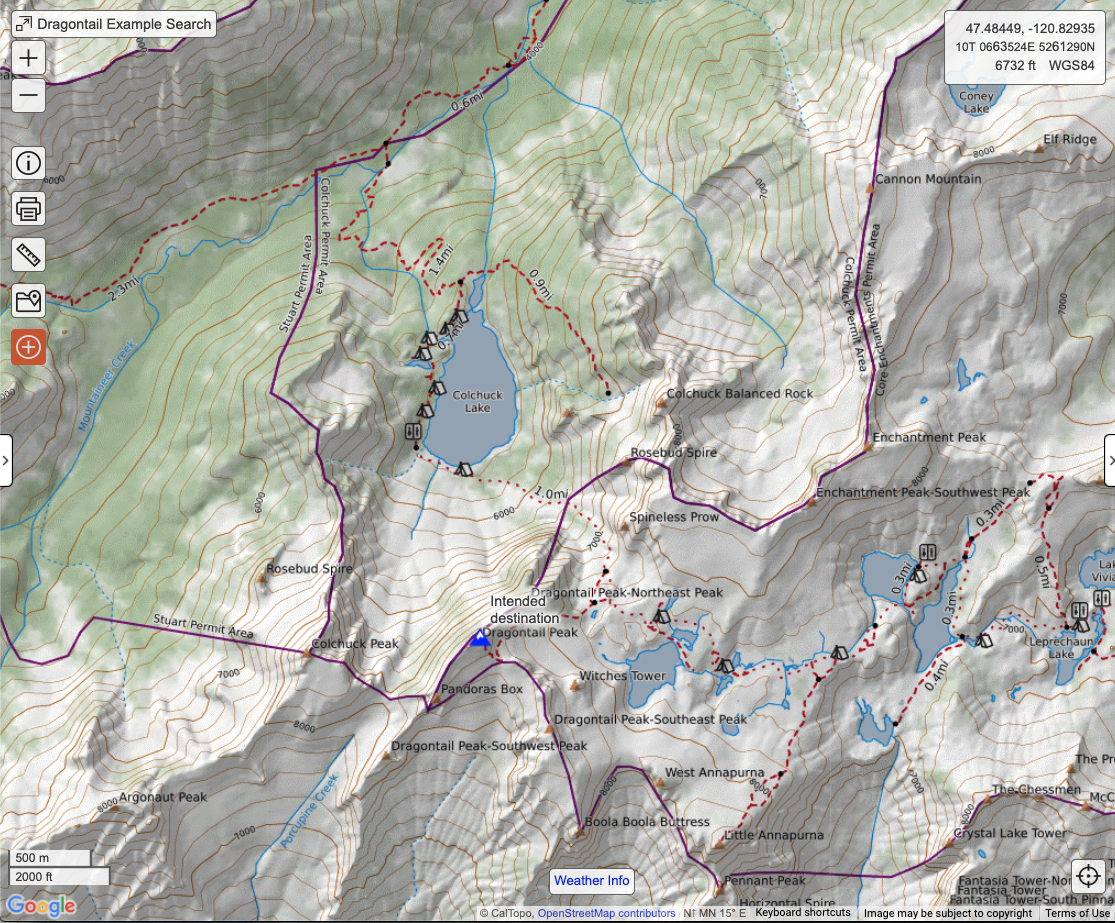
To better illustrate this point, let’s consider the missing climber in scenario #3. Using slope angle shading, you may notice the steep terrain that is present along much of the climber’s intended route. In particular, the northwest face of Dragontail Peak appears to be a series of cliffs that could present a potential fall hazard to both the missing party and your field teams. Stacking aerial imagery, such as Global Imagery, on top of a topographic base layer allows you to further investigate the terrain and figure out exactly what you are viewing. In this example, you can confirm that the northwest face of Dragontail Peak is indeed cliffs and may have a permanent snowfield at the bottom as well as extensive talus.
Adding a marker, line or polygon allows you to draw attention to a particular feature and very clearly call it out to others. In this example, adding a polygon to identify the cliff band can be helpful to both search managers as they plan assignments and consider possible scenarios the missing party may have encountered as well as field teams as they navigate the terrain.

Exercise #4
Use base layers and overlays to evaluate the search terrain for potential hazards to your search teams. Create a folder for hazards, and use markers and/or polygons to identify label the three following hazards. Make sure these hazards are in the hazard folder. Look for:
- The most recent nearby burn area (hint: 2021).
- Two areas of steep cliffs where you do not want searchers to travel.
Grading Criteria:
- Hazards Folder exists.
- The three correct hazards (listed above) are marked appropriately on the map and are in the hazards folder.
Reference Links:
Assess Current and Forecasted Conditons
CalTopo provides access to both current and forecasted conditions, including weather shading, the wind plot, point forecasts, and avy forecasts. It also includes access to realtime data for weather conditions, snowpack, and water flow. Quickly flipping through these helps both ground teams and IC make quick decisions about how to prepare for conditions before deployment.
As we know, weather is a critical factor that often leads to the need for a mission in the first place, and can have a significant impact on how the mission is carried out. It affects the condition and survivability of the missing or injured party, extra gear and equipment required to perform the mission, and what resources and be used.
CalTopo allows you to display current and forecasted conditions directly on your incident map so you can synthesize data from multiple sources all in one place.
Forecasts
Let’s consider the missing climber in scenario #3. Imagine it’s early November in the Cascade Mountains, and your hasty teams are headed into the field during the early afternoon. What would you want to know about current conditions in order to effectively prepare your teams?
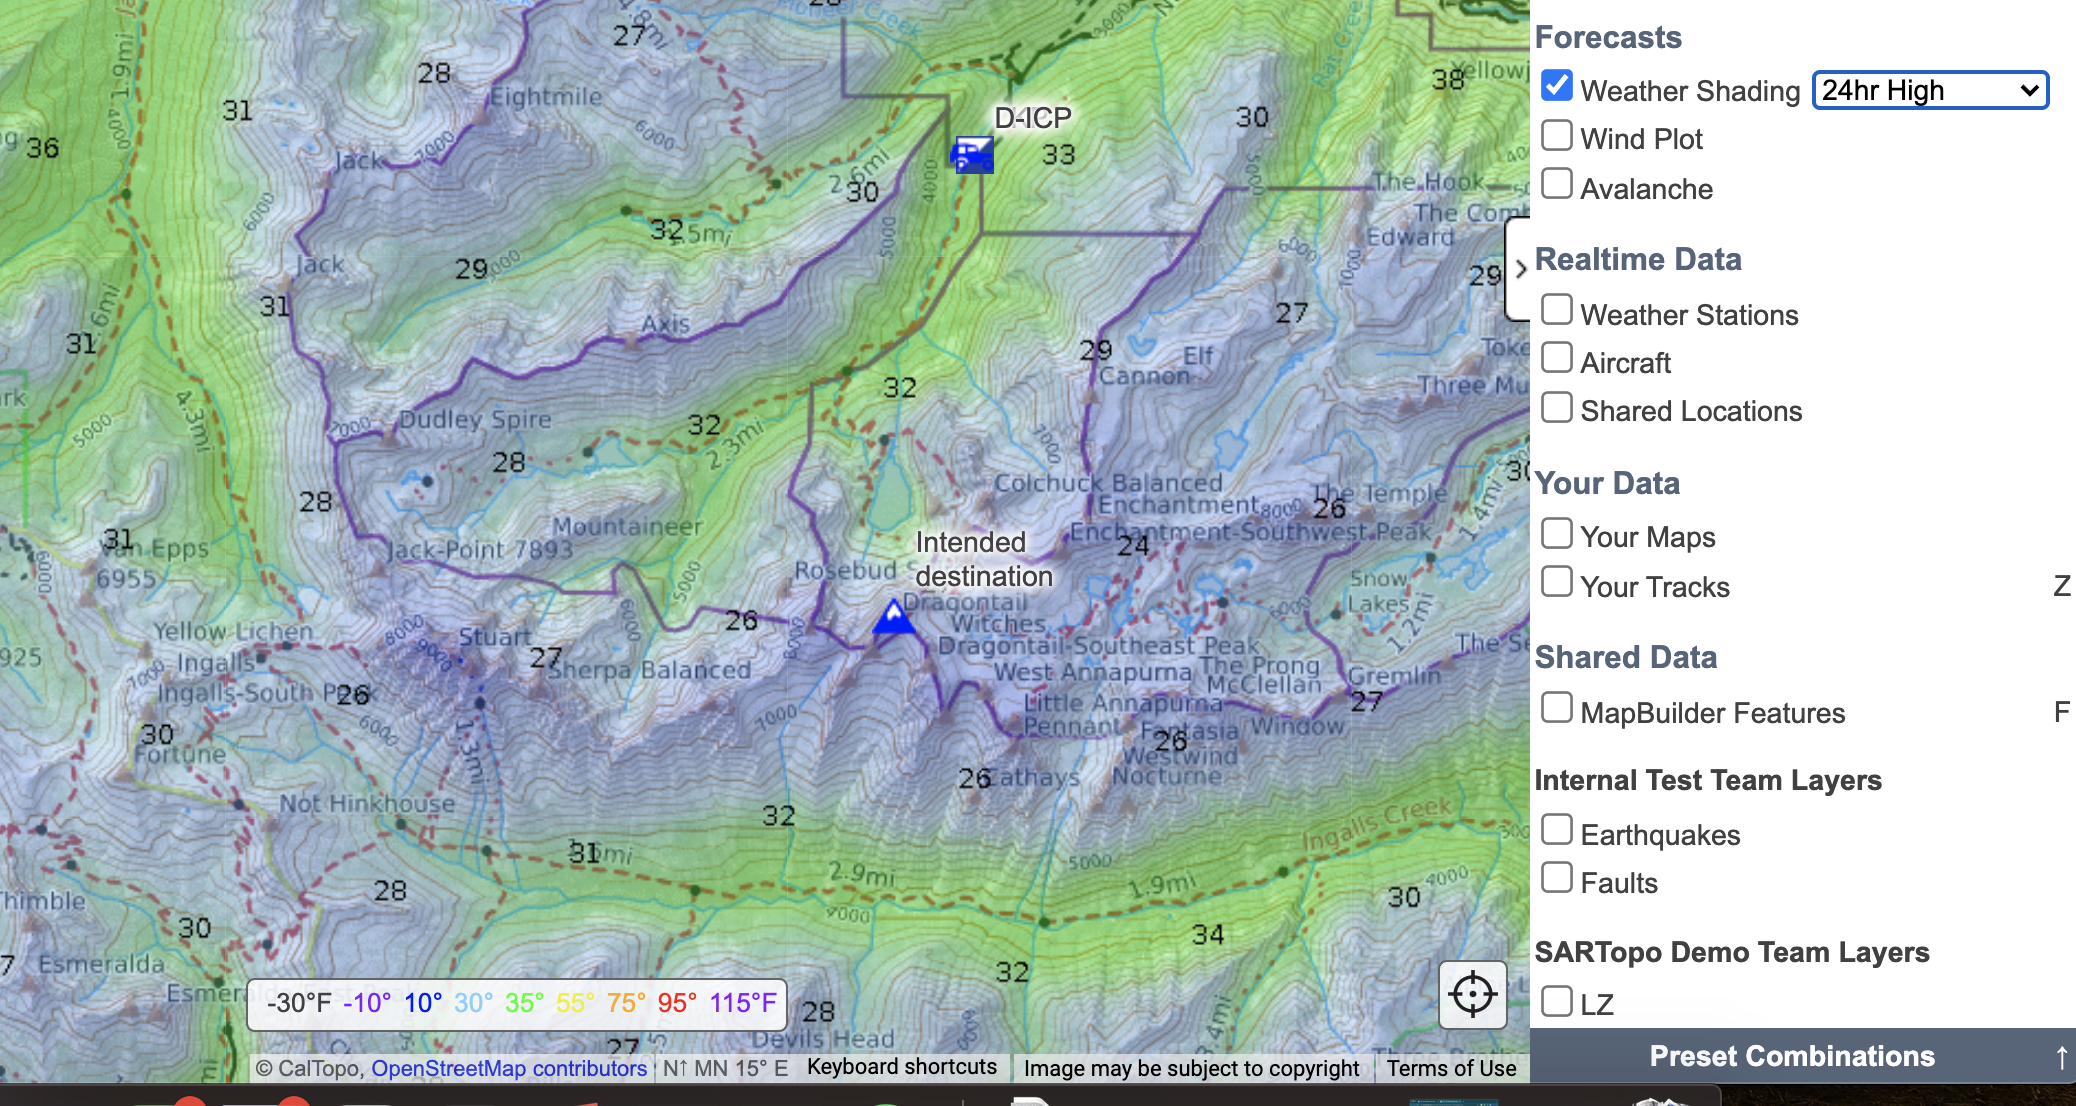
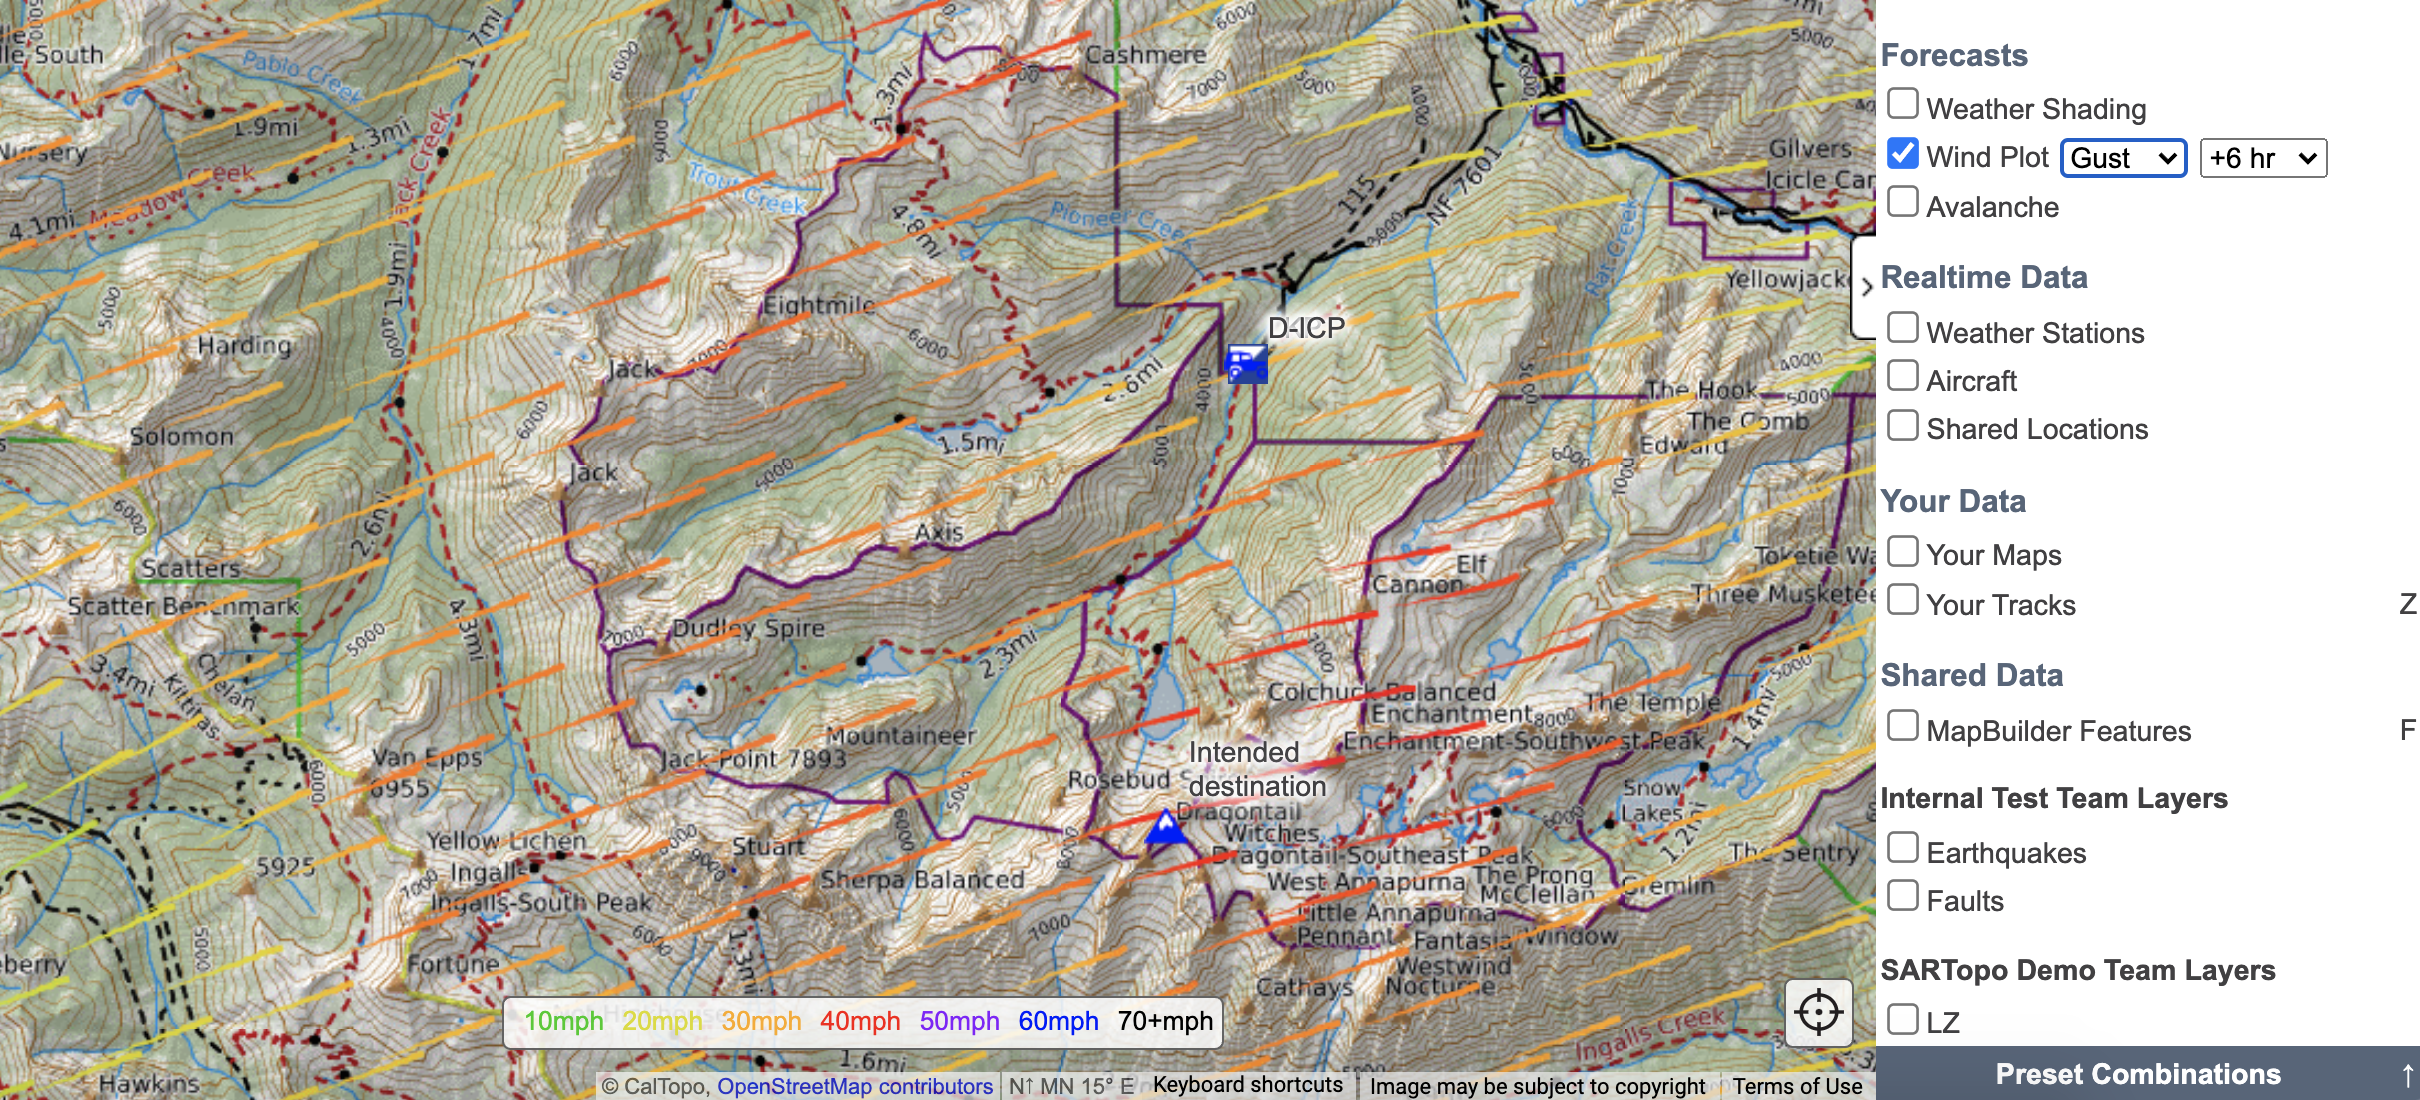
The weather shading overlay displays forecasted temperature, precipitation, snowfall, wind speed and wind gusts from the National Oceanic and Atmospheric Administration (NOAA) for up to 48-hours in the future directly in your map. The wind plot overlay provides a powerful visualization of current and forecasted average wind speed and direction.
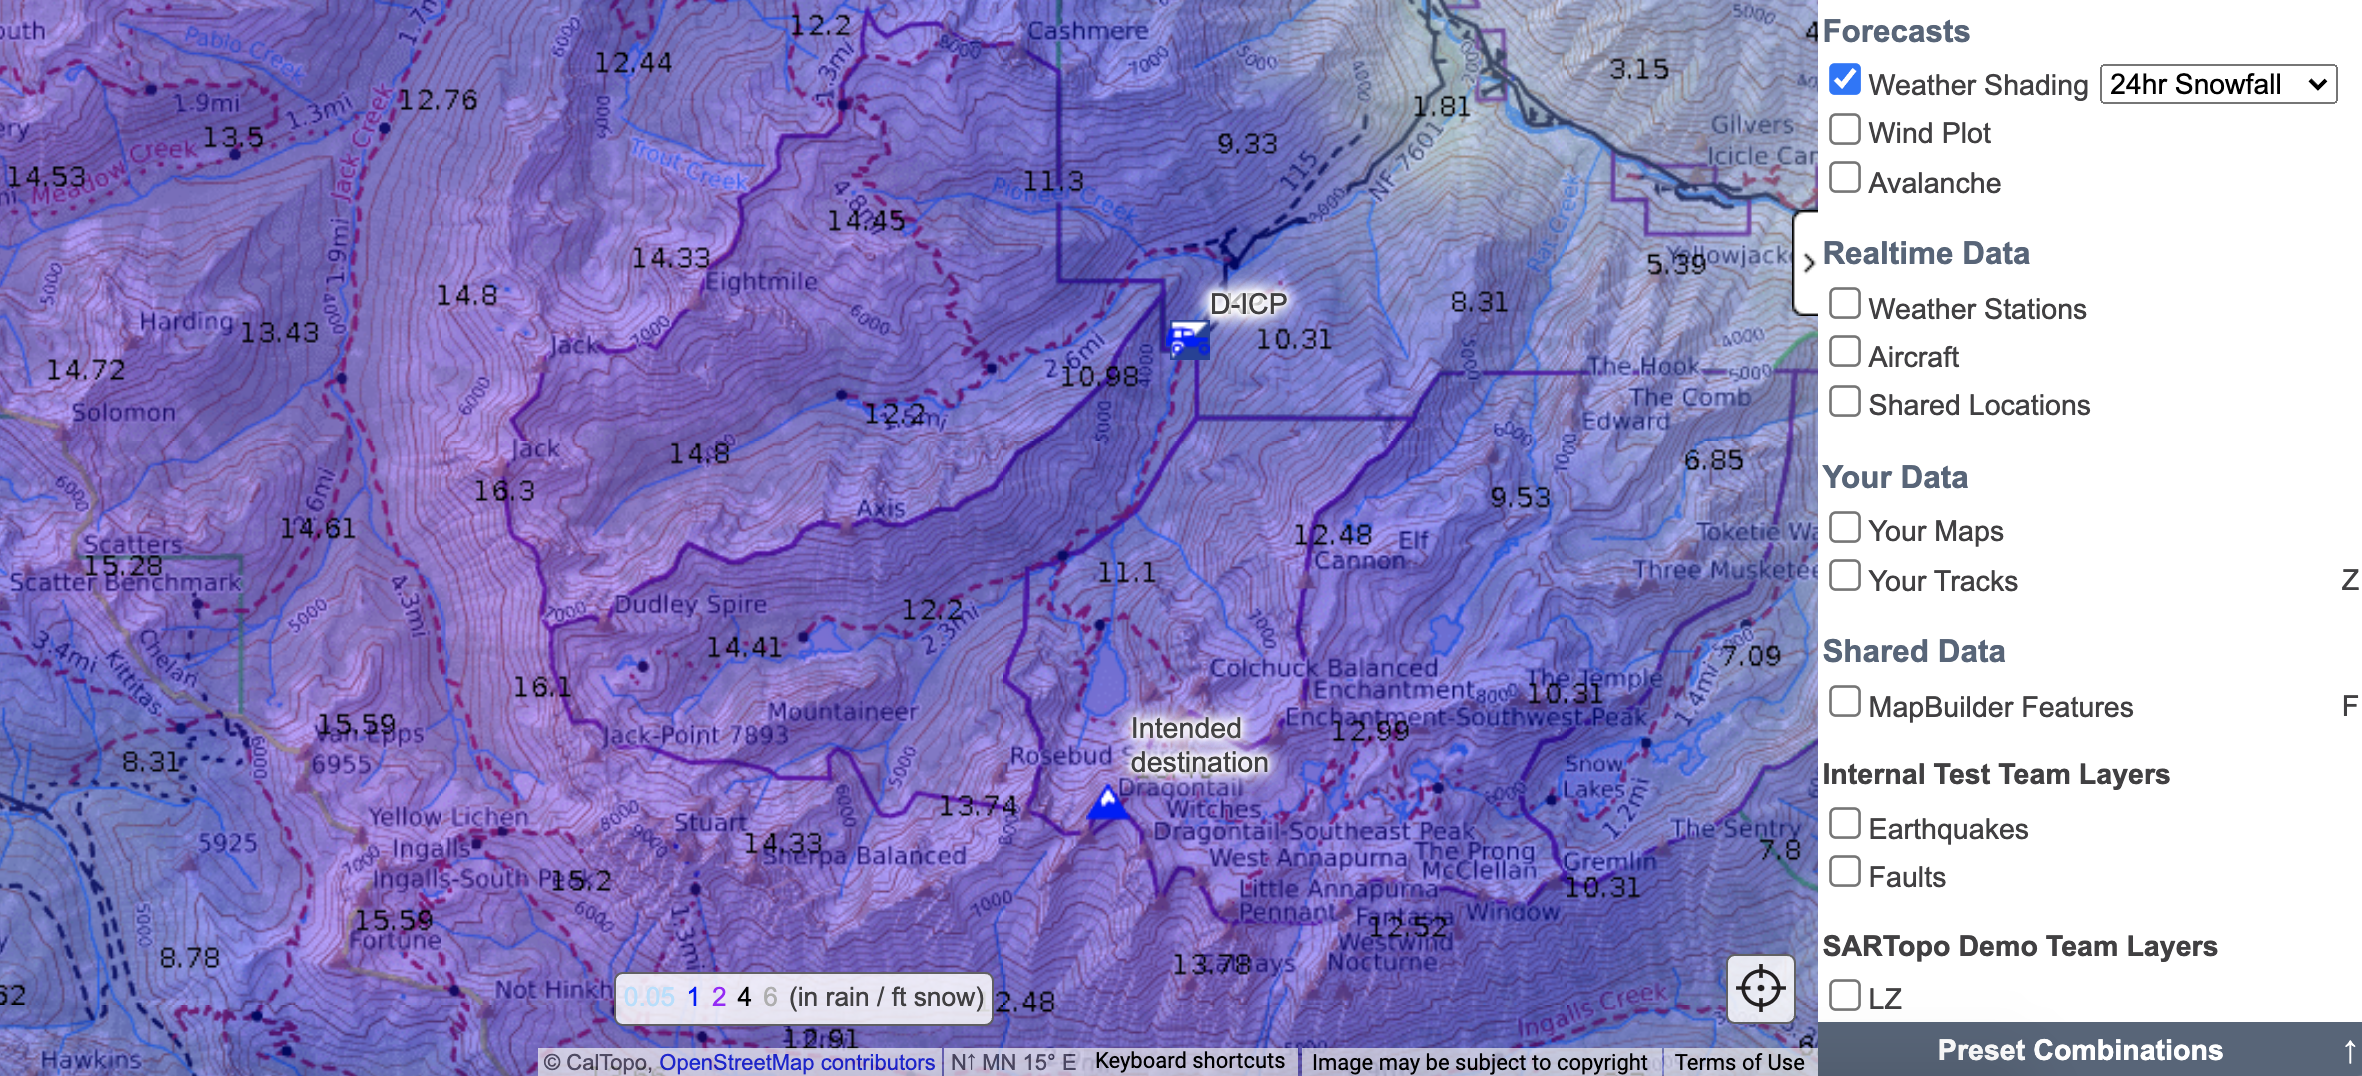
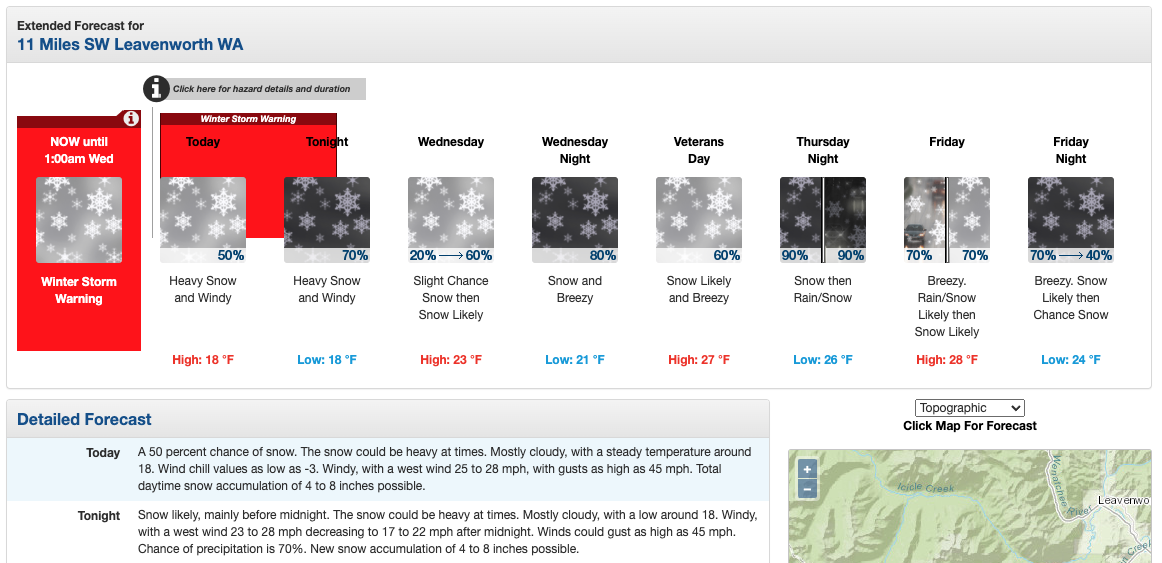
If you displayed the 24-hour high temperature and snowfall forecast for the search area for the missing hiker then you would know to expect miserable conditions, with snow up high and warmer temperatures at the trailhead indicating the likelihood of rain, which you could also confirm by looking at the precip forecast view.

Taking a look at the wind plot overlay shows strong winds from the west-southwest. Given this information, you would want to make sure field teams are properly equipped with plenty of warm layers for themselves and prepared to treat a potentially hypothermic patient in the field.
Additionally, you can right click on any point on the map and select "NOAA Forecast" to get a detailed point forecast.
Current Conditions
The realtime data overlays and the Sentinel Satellite base layer provide information about current conditions.
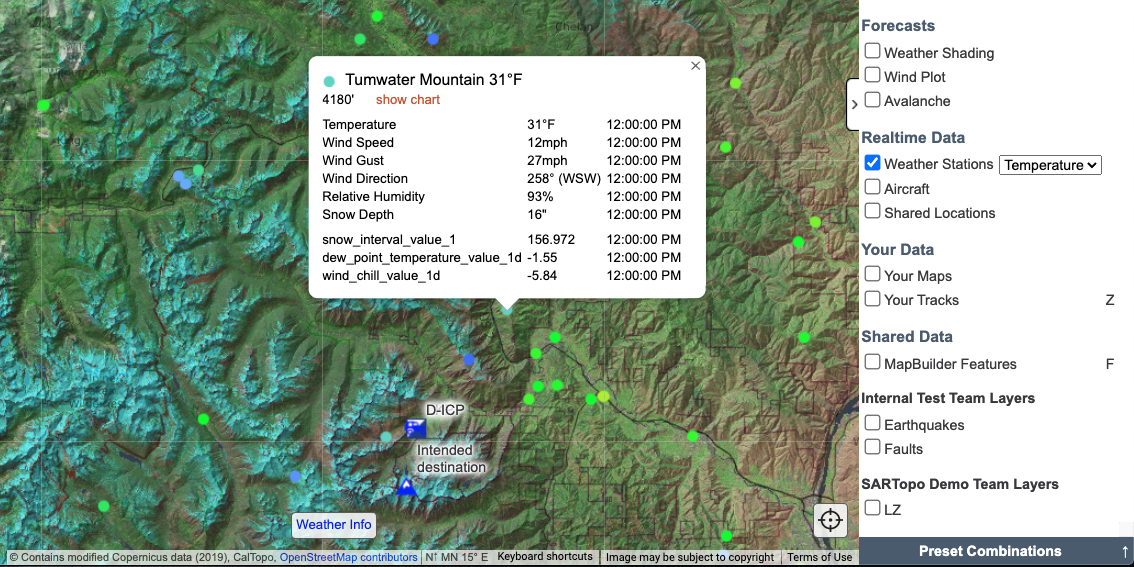
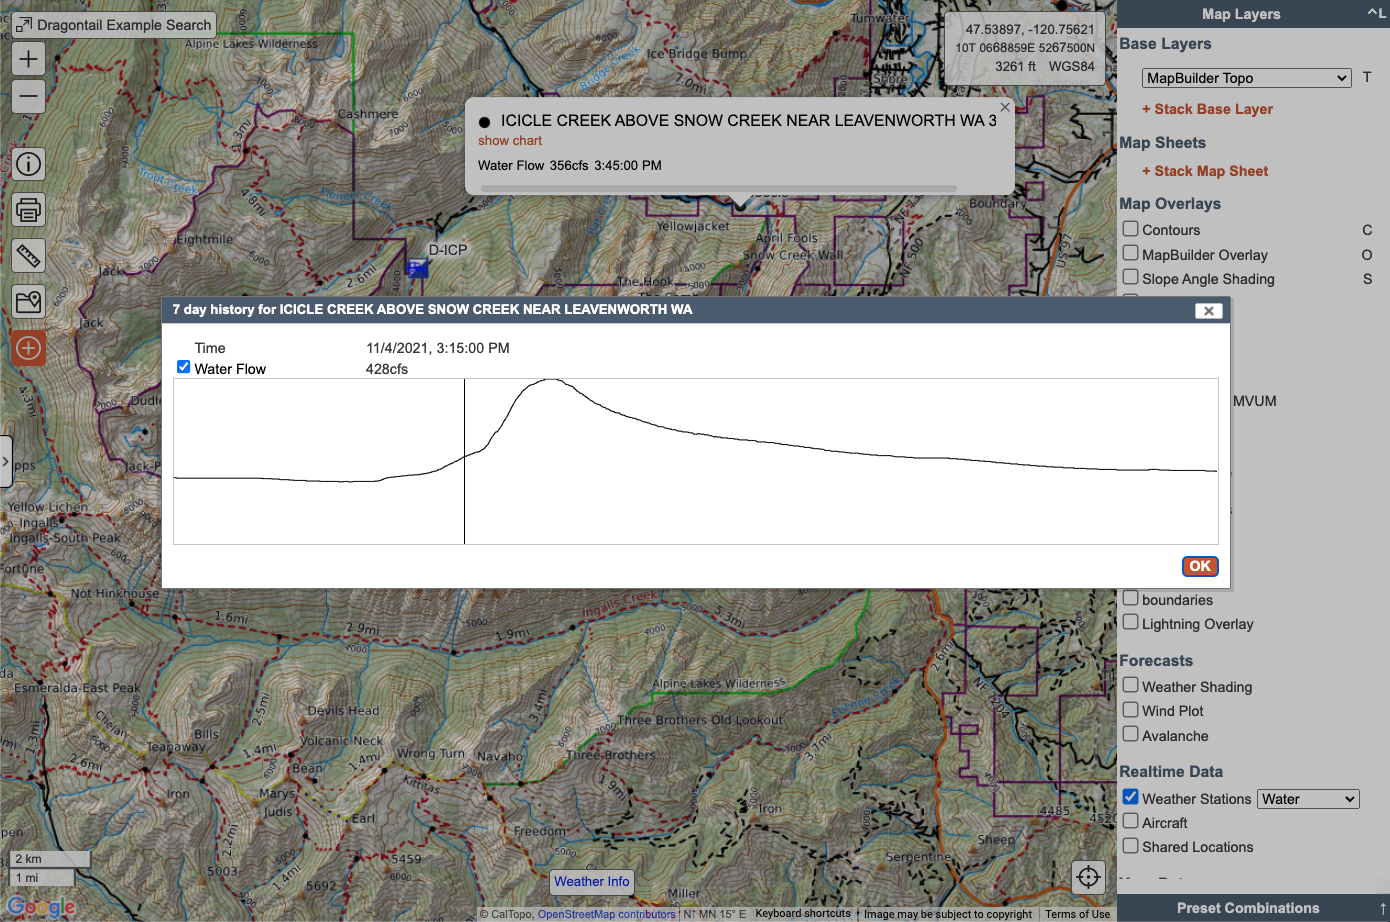
The weather stations overlay will show dots on the map where there are stations. Clicking on the station opens a dialog with additional information. You can also choose what type of data to view from the drop down in the overlay menu. Temperature, wind, water, snowpack, and air quality are all options here.
To continue with the same example as above for Dragontail peak in November with an incoming storm, you would check the current reported temperature and winds, then look for a nearby SnoTel sensor via the Snow option. These will let you see snow depth and water content, as well as the change to the depth over the past 7 days. If the snow levels are rapidly increasing or decreasing (as in a rain-on-snow event), that would be cause for concern. Finally, if it’s raining a lot, you might keep an eye on the Water stations to see if creeks are rapidly rising nearby.

Sentinel Satellite
For incidents that occur in mountainous regions, snow conditions are another important factor to consider. Let’s look again at the missing climber in scenario #3. This time, imagine it’s the beginning of June, which is a very transitional time in many mountainous areas like the Cascades. Snow has typically started to melt at lower elevations but still persists at higher elevations.
Live satellite imagery like Sentinel Weekly can offer insight into current snow conditions. This imagery is updated approximately every 5 days and, with 10-meter horizontal resolution, it’s powerful enough to zoom in on an individual snow patch and assess snow coverage. Furthermore, setting the Sentinel imagery to display as false color green and then stacking it with Enhanced shaded relief provides depth and scale, and the MapBuilder topo as a third layer provides additional context.
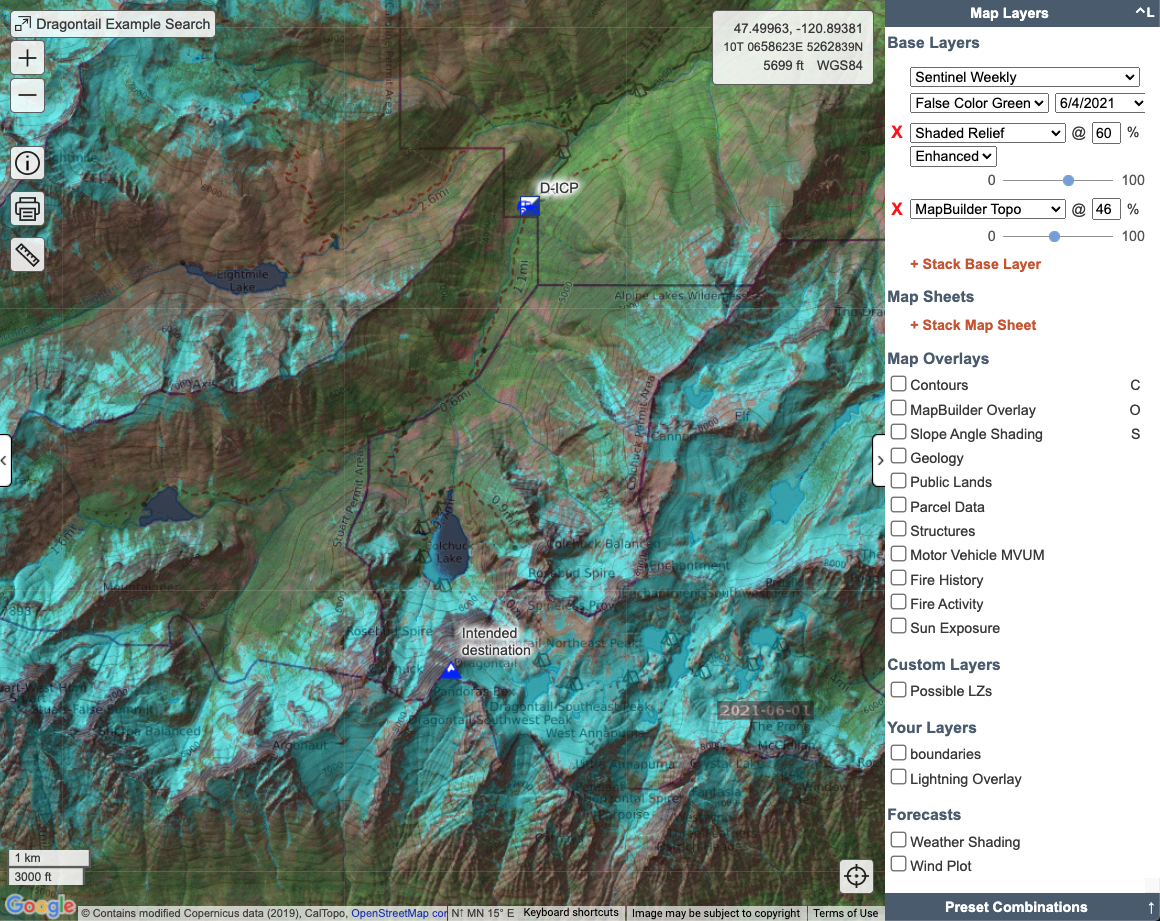
Try it yourself by navigating to Dragontail Peak, WA, adding the Sentinel imagery from 6/4/2021 and setting it to False Color Green. Stack another layer and set it to shaded relief, then choose “enhanced” from the drop down menu. Toggle this to about 60%. Finally add a third layer as MapBuilder Topo, and set that to about 45% or whatever looks useful to you.
Resources for All
Assessing current and forecasted conditions is not just for search managers. Many of the same layers and overlays are also available on the mobile app. As field members start to respond, they can open up the mission map on their own mobile device and start to get an idea of what to expect so that they can prepare accordingly.
Exercise #5
This exercise will familiarize you with the tools for displaying current and forecasted conditions in an area. Use different overlays to learn about the following current and forecasted weather conditions in your search area:
- Find and view the current and forecasted weather.
- Locate the two nearest snow level reporting stations and determine if the snow depth has increased or decreased over the last 72 hours.
- Display the forecasted wind gusts and direction over the next 24 hours.
To indicate that you have done this task, add a marker to your Hazards folder. In the description for that marker, describe the conditions that you found during your research.
Next, use the False Color Green layer of Sentinel Satellite to determine if there was snow at Jack's Creek Campground on 11/19/2022. Add another marker to your Hazards folder indicating either "Yes, All Snow," "Patches of Snow," or "No, Dry Ground."
Grading Criteria:
- Marker inside Hazards Folder has a description of the 72 hour change in snow level and the forecasted wind gusts values.
- Marker inside Hazards Folder indicates snow status at Jack's Creek Campground on 11/19/2022.
Reference Links:
Preparing for an Incident-within-an-Incident
It’s never too early to start planning for an incident-within-an-incident (IWI). From the hasty search through the last operational period, you will be putting teams and resources into the field. Mapping is a key component of preparing for a potential IWI.
Identify Ingress and Egress Options
From a mapping perspective, identifying possible ingress and egress routes for your search area is a simple yet important step for determining how you will get teams into and out of the field, both during the typical course of the search as well as in the event of an IWI. Topographic maps, such as Forest Service and Scanned Topos in particular, can be very helpful for identifying roads in less traveled areas, such as logging roads in the backcountry.
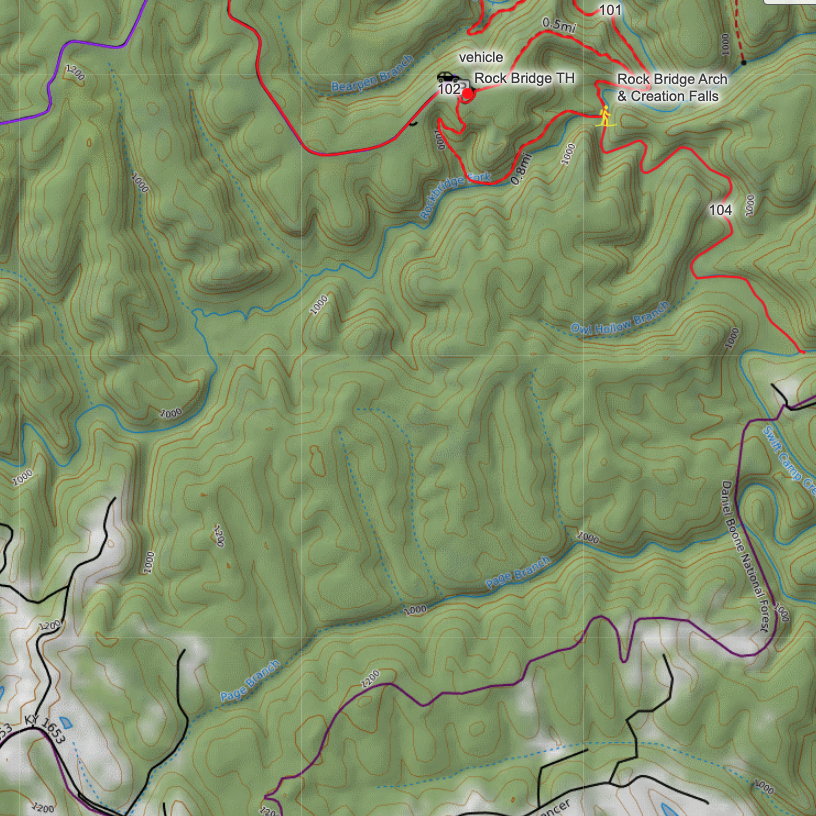
For example, let’s consider the missing hiker in scenario #2. Examining MapBuilder Topo can give you an idea of what roads there are; however it doesn’t provide any insight into the type or condition of the road. Are they paved roads? Four-wheel drive? Well maintained or not maintained at all? In addition, remember that MapBuilder Topo draws much of its road and trail data from OpenStreetMap (OSM). If a road or trail is not part of the OSM database, it won’t appear on this base layer.
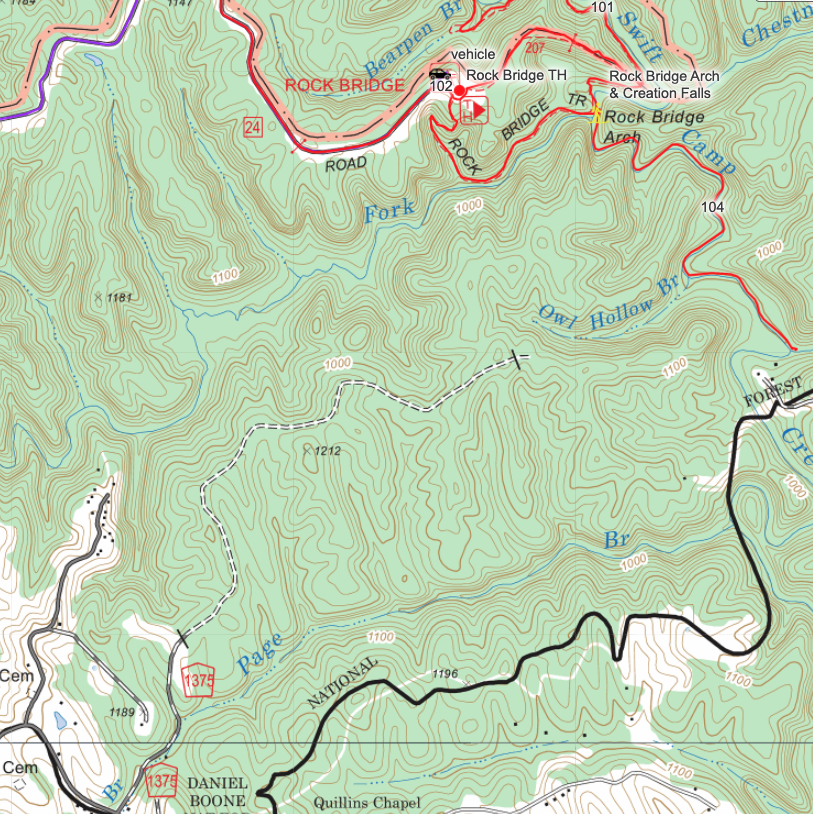
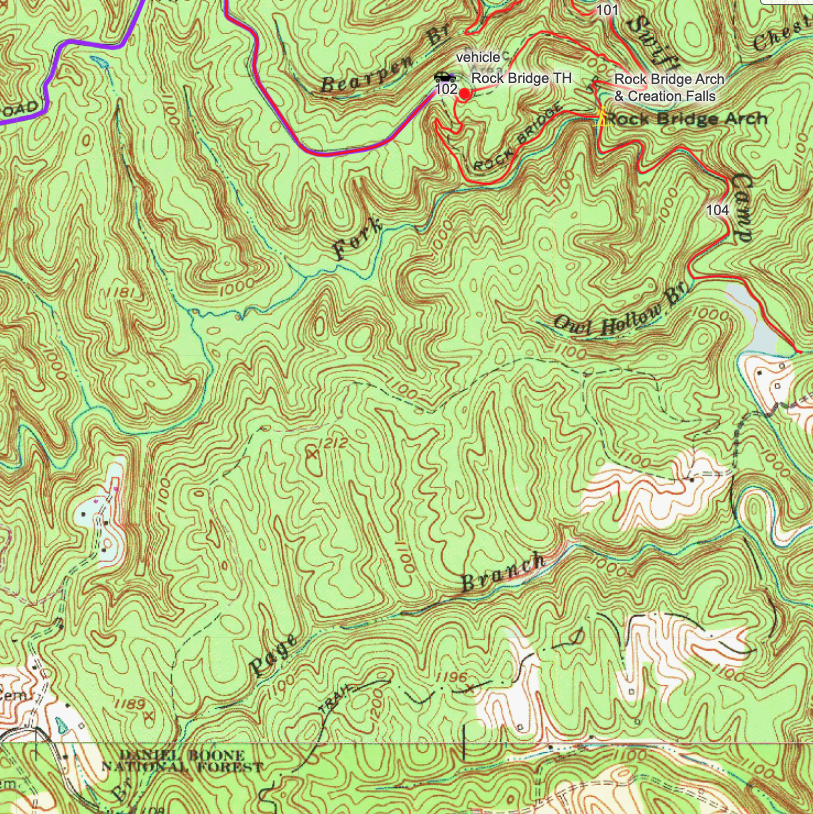
Switching to the Forest Service layer reveals a road that was not visible on the MapBuilder Topo. This road is gated and may not be maintained. Switching to the Scanned Topos layer reveals more clues about its condition. It looks like it might be more of a trail than a road, and maybe connects through to Camp Creek. This could provide an access path to the south end of the search area, especially if the progression of the search incorporates this ridge.
As you did with hazards, calling out possible ingress and egress routes with map objects allows you to communicate their location to search managers, who can use it to inform their planning, and to field teams, who may need to use those routes for insertion and/or extraction. Adding map objects also ensures that those routes will be visible no matter which base layer someone is viewing.
For this example, adding a marker to label the road allows you to identify the Forest Service road as a potential ingress and/or egress option if you end up searching this ridge. You can even include details in the comments section in regards to the condition of the road and the type of transportation required.
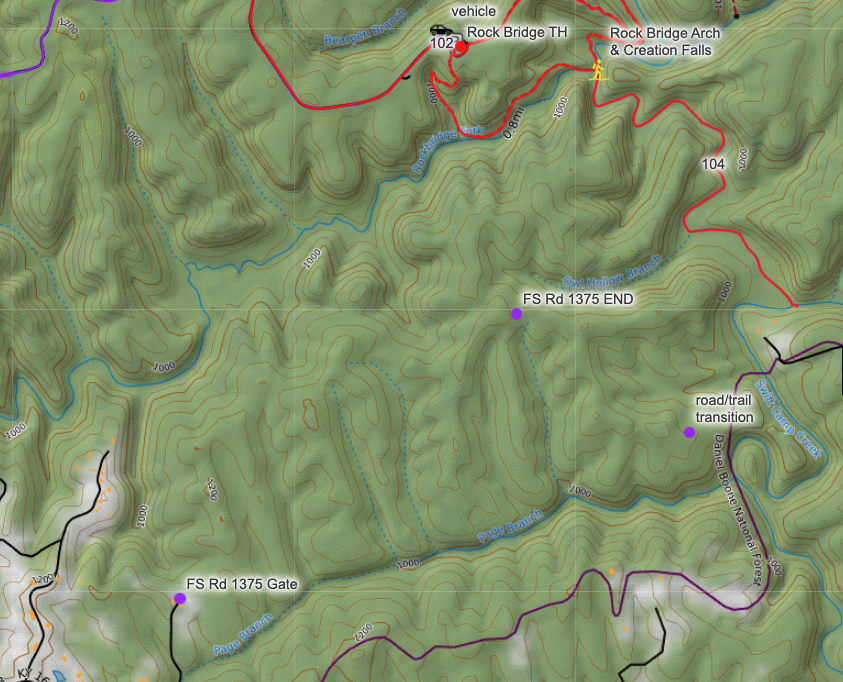
Nearby is some private property on a paved road that might provide good access to the search area as well. Before entering the private property we would want to connect with the land owners to request permission.
It’s a good practice to identify possible ingress and egress routes early in your planning, even if you never end up using them as part of your mission response. Having plenty of options for how you can get teams into and out of different parts of the search area allows you to be prepared for the unexpected in the course of a search.
Other things to consider looking for in this area include breaks in cliff lines and roads that provide access from the other ends of the search area.
Exercise #6
Imagine that during the course of the search, a searcher gets injured and needs to be evacuated from Truchas Lakes. Identify and compare possible egress routes for the injured searcher. What is the shortest trail route to the nearest paved or 2wd road? Is that route the most reasonable in terms of elevation gain and loss as well?
Assume a ground evac. Add a marker to the map at the trailhead you choose as the end of the best route out from Truchas Lakes, at the place where a vehicle would meet the team. Label it as “Egress from Truchas Lakes” in order to indicate your chosen route. In the comments area for the marker, write the distance and elevation gain and loss to Truchas Lakes, and explain why you chose that route.
Grading Criteria:
- Marker at trailhead for best ground egress route from Truchas Lakes.
- Elevation gain and loss, as well as distance, indicated in marker description.
- Explanation of why route was chosen as best evac route.
Reference Links:
Landing Zone Identification
Identifying possible landing zones (LZs) is a vital part of your search planning. While helicopters are often used for aerial searching, you may also be using them to insert and/or extract searchers, or as part of the response in the event of an IWI.
Suitable LZs must meet a strict list of criteria to ensure the safety of the crew and passengers. The need to be clear of trees and large vegetation, near-flat, and anywhere from 75ft square to 150x200 feet or more depending on the size and capabilities of the ship, the conditions, and the crew. Finding sites that meet this criteria can be a daunting task, especially in an unfamiliar area.
Custom layers and overlays in CalTopo let you call out terrain based on a series of criteria so that you can evaluate them for a specific task such as this. Here we will walk through a workflow to help you identify landing zones, but these tools can be used in a variety of ways to help solve the search problem. Of course maps can only provide some of the information. The landing zones you choose through this process may not be viable in reality. Be conservative in your choices and the pilot will make the final decision.
Steps for Identifying Potential Landing Zones
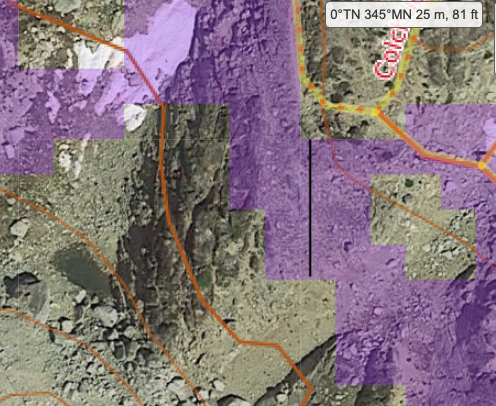
- Terrain Shading
A terrain shading layer highlights terrain that meets the criteria you designate. You can set rules based on the slope, aspect, elevation, and canopy cover, or combinations of these. For this first step in identifying potential LZs, we set the slope values to be limited to between 0° and 5° (max 7° if you’re desperate), and canopy coverage to between 0 and 20%. (Canopy is a fickle thing to work with, so we set the max to 20% to account for inaccuracies or shrubbery that may or may not allow landing.)


Pro tip: once you confirm the layer is displaying as you expect, open the edit box and click “save to account” in the lower left corner (make sure it has a clear name). Then you will not need to re-create this layer for each mission. Go to your layers in your data and move it to the team account so anyone on the team can use it.
- Turn on aerial imagery to visualize the area and evaluate the terrain.
Displaying aerial imagery, such as Global Imagery, allows you to visualize the terrain and further evaluate if it will be a suitable LZ. You are looking for large boulders and talus, steep walls bordering the area, trees or vegetation that were missed by the DEM layer, or any other hazards or challenges to landing.

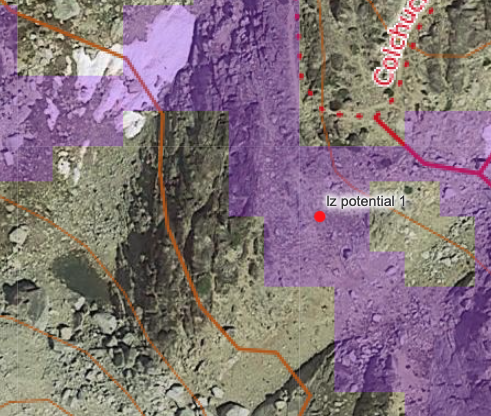
- Measure the area using the distance measuring tool.
Now you’ll want to measure and mark areas that show potential. Measure the length and width of the area with the distance measure tool. Also double check the point slope angle at a couple of spots within your chosen area.
Pro-Tip! Use markers, rather than polygons, to indicate Landing Zones on your map. Markers have two advantages for this purpose. First, they scale well as you zoom in and out on the map viewer. Polygons get lost as you zoom out, but markers remain visible. Secondly, this gives you the option of printing a coordinate list of all the LZs very easily from the print menu. This coordinate list is a quick and easy way to communicate to pilots about your potential landing sites.
As you identify areas that are near-flat, relatively free of canopy cover and large enough to land a helicopter, add a marker to designate those areas that warrant further investigation. These should be labeled as potential LZs or in their own folder. Doing so will help with the next step.
- Investigate each marked LZ in Google Earth.
Now that you have done some initial investigation of the sites, the final step is to verify your site selections by visualizing them in Google Earth. Use the KML network link option in the export window, and start exploring your sites in 3D in Google Earth.
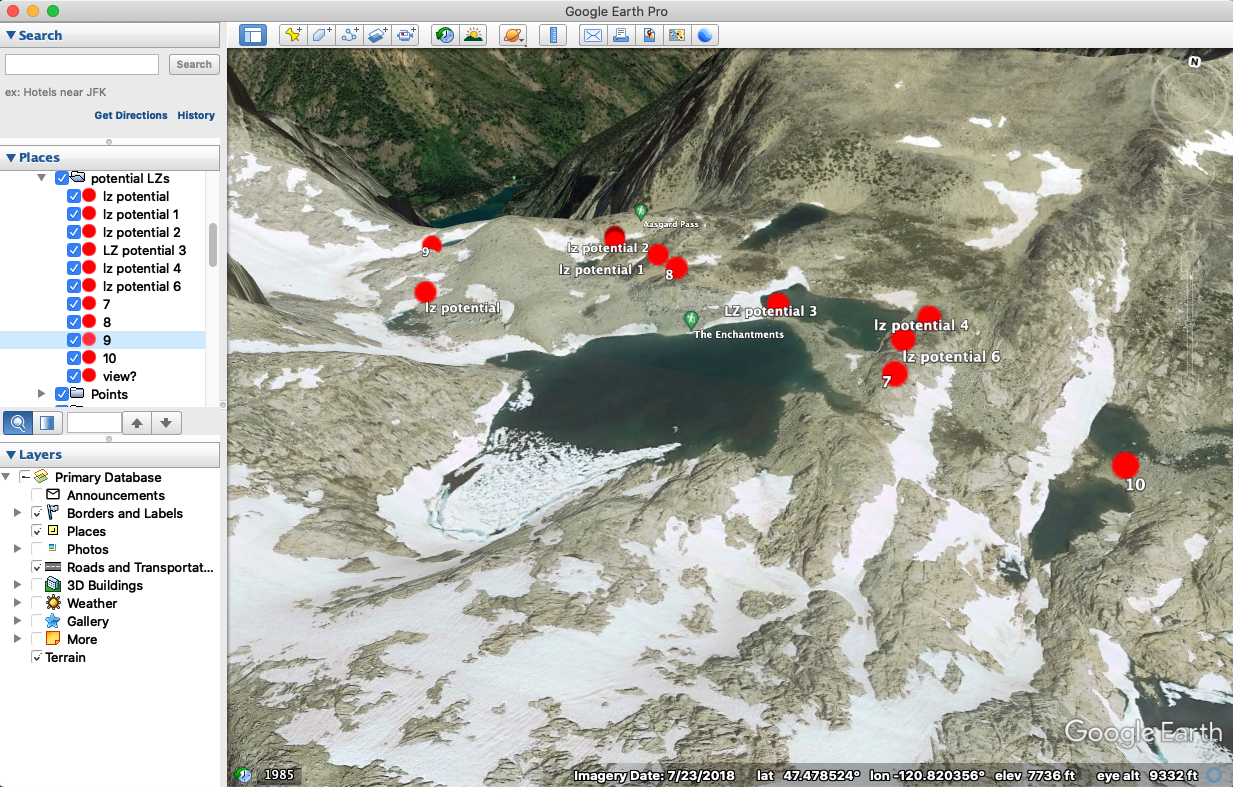

With the KML network link, any updates you make in CalTopo will carry over to Google Earth. As you evaluate sites in GE, update the markers in CalTopo and confirm the new location in GE. This allows you to hone in on the best possible options for your LZs and provide precise coordinates for each suitable LZ to the helicopter crews. Once you have established that each LZ will or will not work, update it with a good name or delete it from the CalTopo map.
It’s a good practice to get in the habit of identifying suitable LZs early in your search planning; proactive LZ identification prevents you from having to scramble once helicopter teams arrive, make the most of valuable and limited flight time, and helps you to respond more efficiently in the event of an IWI. Always give your helicopter crew several options, or your searchers may end up somewhere nowhere near where they need to be.
Exercise #7
A helicopter is now available to try to pick up the injured searcher at Truchas Lakes. Follow the steps outlined above to identify 3 possible LZs near Truchas Lakes. Make sure that each LZ meets slope, canopy cover, size and terrain criteria, and double check each LZ in Google Earth. Add these MARKERS to a folder called Landing Zones (create one if you do not have one already), and label them Truchas LZ 1, 2, and 3. Indicate one of these as the best option for getting the injured searcher to the ship by writing a note in the comments.
Grading Criteria:
- There is a terrain shading layer on the map with correct variables chosen.
- LZ folder exists.
- There are 3 markers in the Landing Zones folder called Truchas 1, Truchas 2, and Truchas 3.
- The slope at the marker is under 5 degrees, canopy is clear, and the area around the marker is large enough to accomodate a helicopter.
- One of the three is indicated as likely best option for evac.
Reference Links:
Conclusion
From the very beginning of a search through the final stages, team safety is a top priority. Make it a habit to create your safety plan early on and continually refine and communicate the plan to field teams as new information comes in.
In this chapter we covered how to use CalTopo mapping tools to assess some risks and develop your safety plan throughout an incident. This included how to utilize base layers and overlays to assess current and forecasted conditions; how to recognize and call out hazards using map objects; how to identify and label potential ingress and egress routes into and out of your search area; and how to use layers and Google Earth to locate and evaluate potential helicopter landing zones.
At this point in the module, you should have assessed current and forecasted conditions, added map objects to call out distinct hazards, identified potential ingress and egress routes, and identified potential helicopter landing zones on your incident map.