Measure Menu
let's begin
The Measure menu is a great tool for gathering data quickly without saving anything to the map.
The Measure menu is available on both the web and the mobile app, with some differences in the tools offered. Most core features are supported on both platforms. Keep reading to learn how to use the Measure menu on each, or click any tool name below to jump directly to that section.
Topics on this Page:
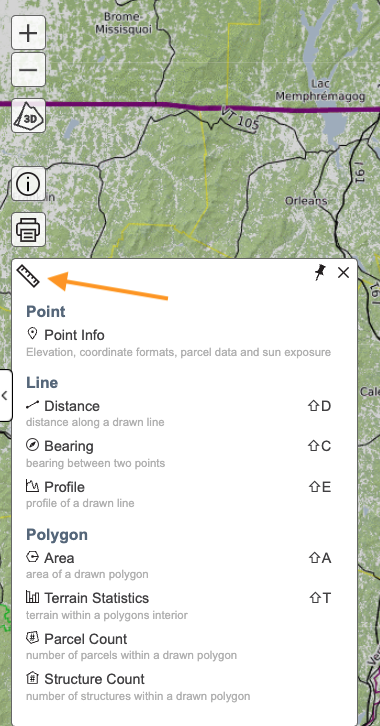
Accessing the Measure Menu
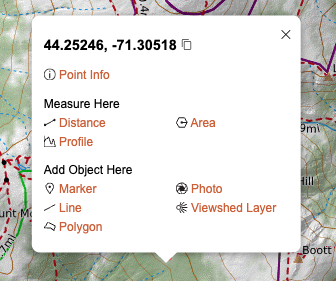
To access the Measure menu on the web, click the Measure button on the left side of the map viewer. Some measurement tools are also available by right-clicking on the part of the map you want to explore. These tools will appear under the Measure Here section of the menu. You’ll also see the Point Info feature, when you click on a marker.
Measure Menu on Mobile
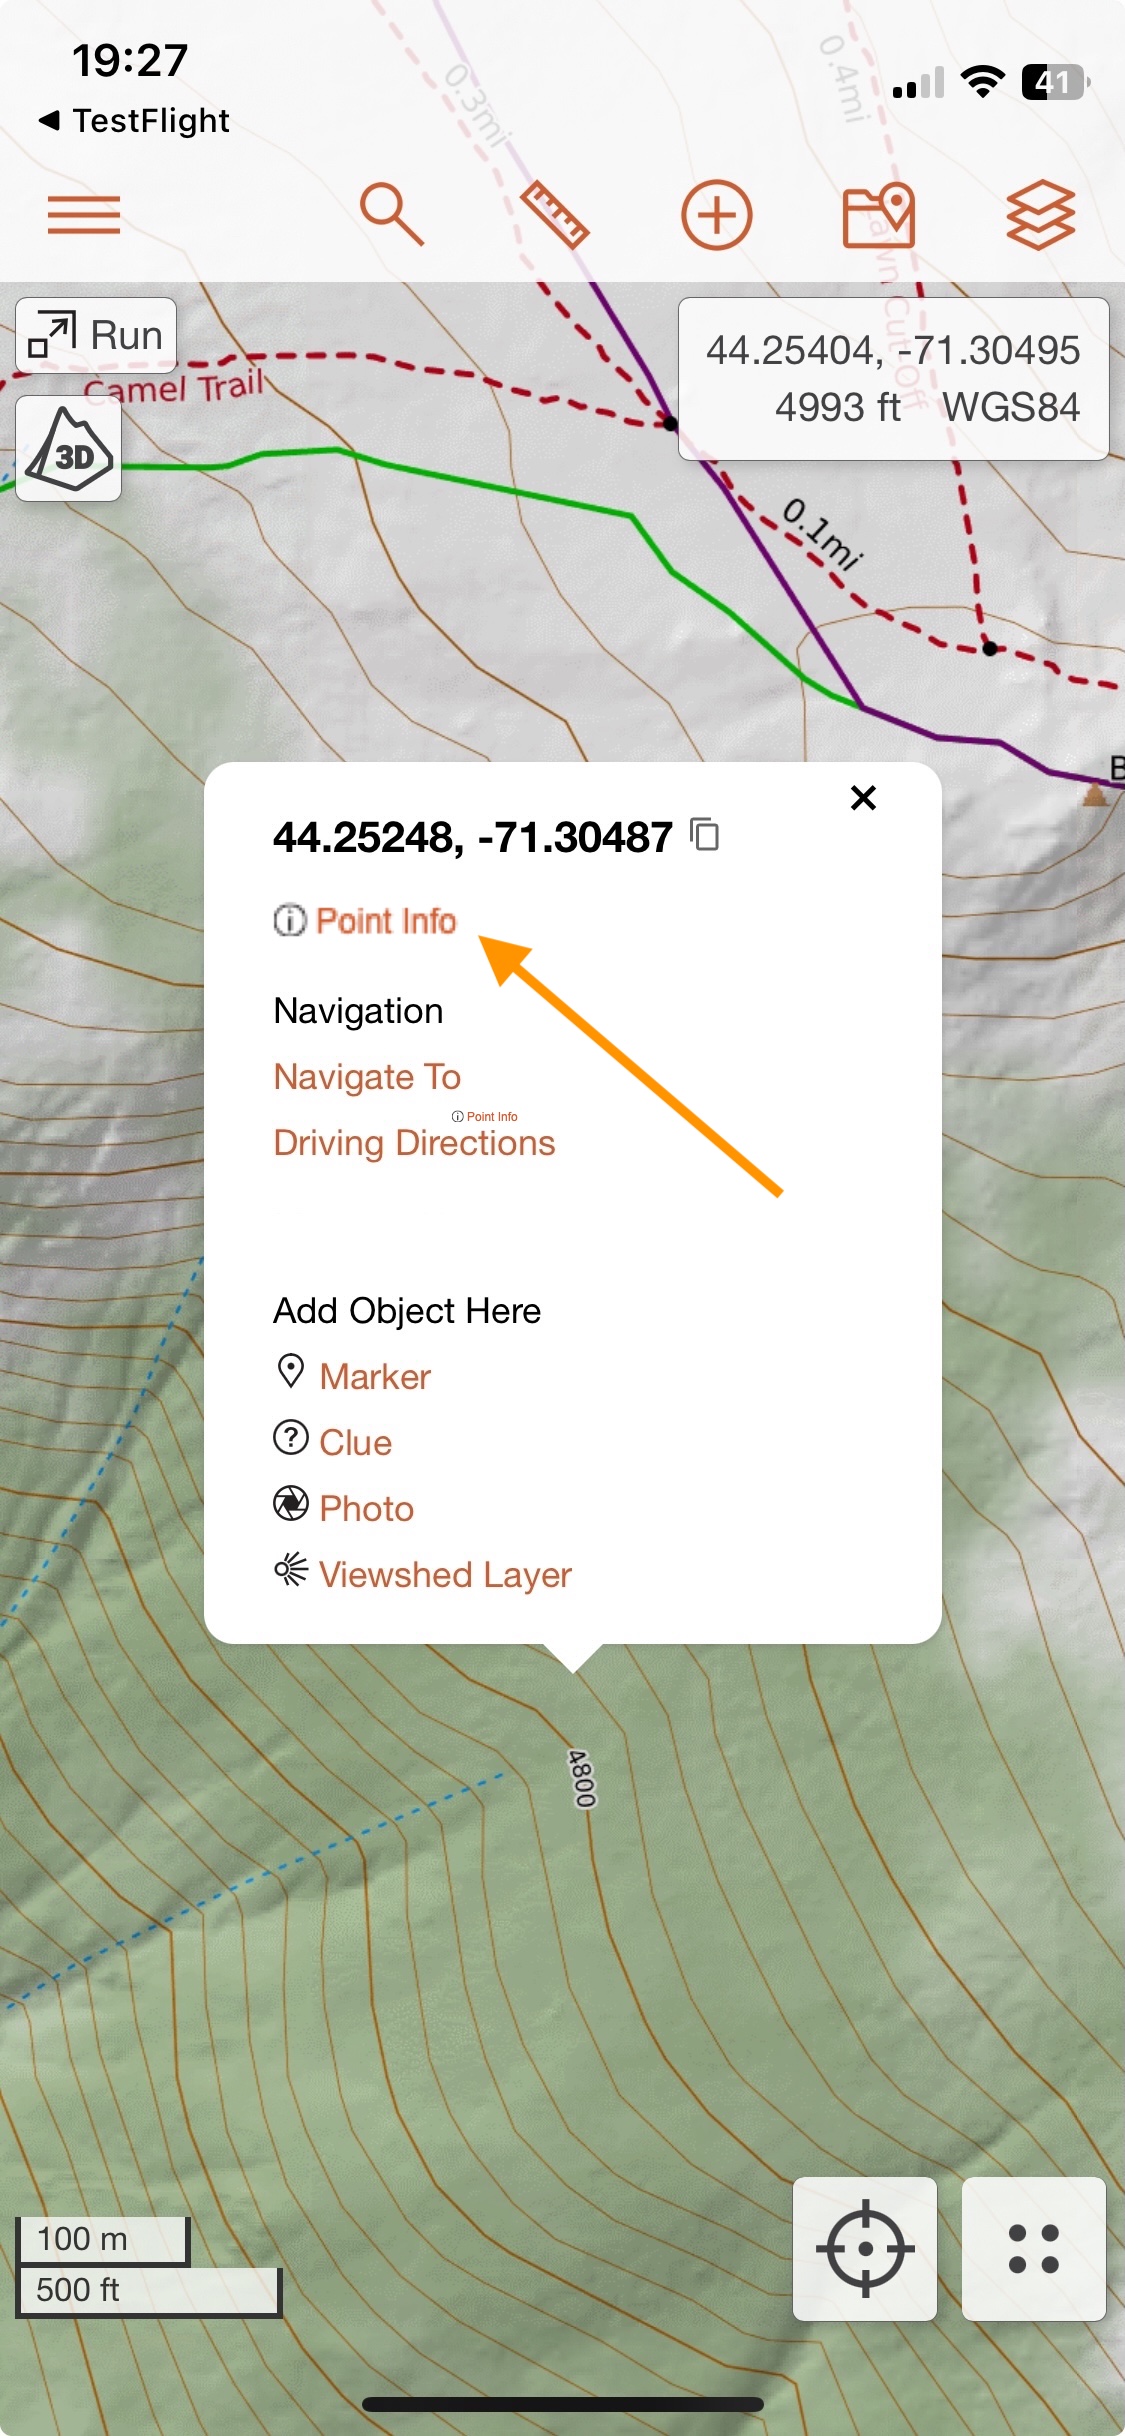
To access the Measure menu on the mobile app, tap the ruler icon at the top of the screen. You can also get information about a location by long-pressing on the map or tapping a marker, then selecting Point Info.
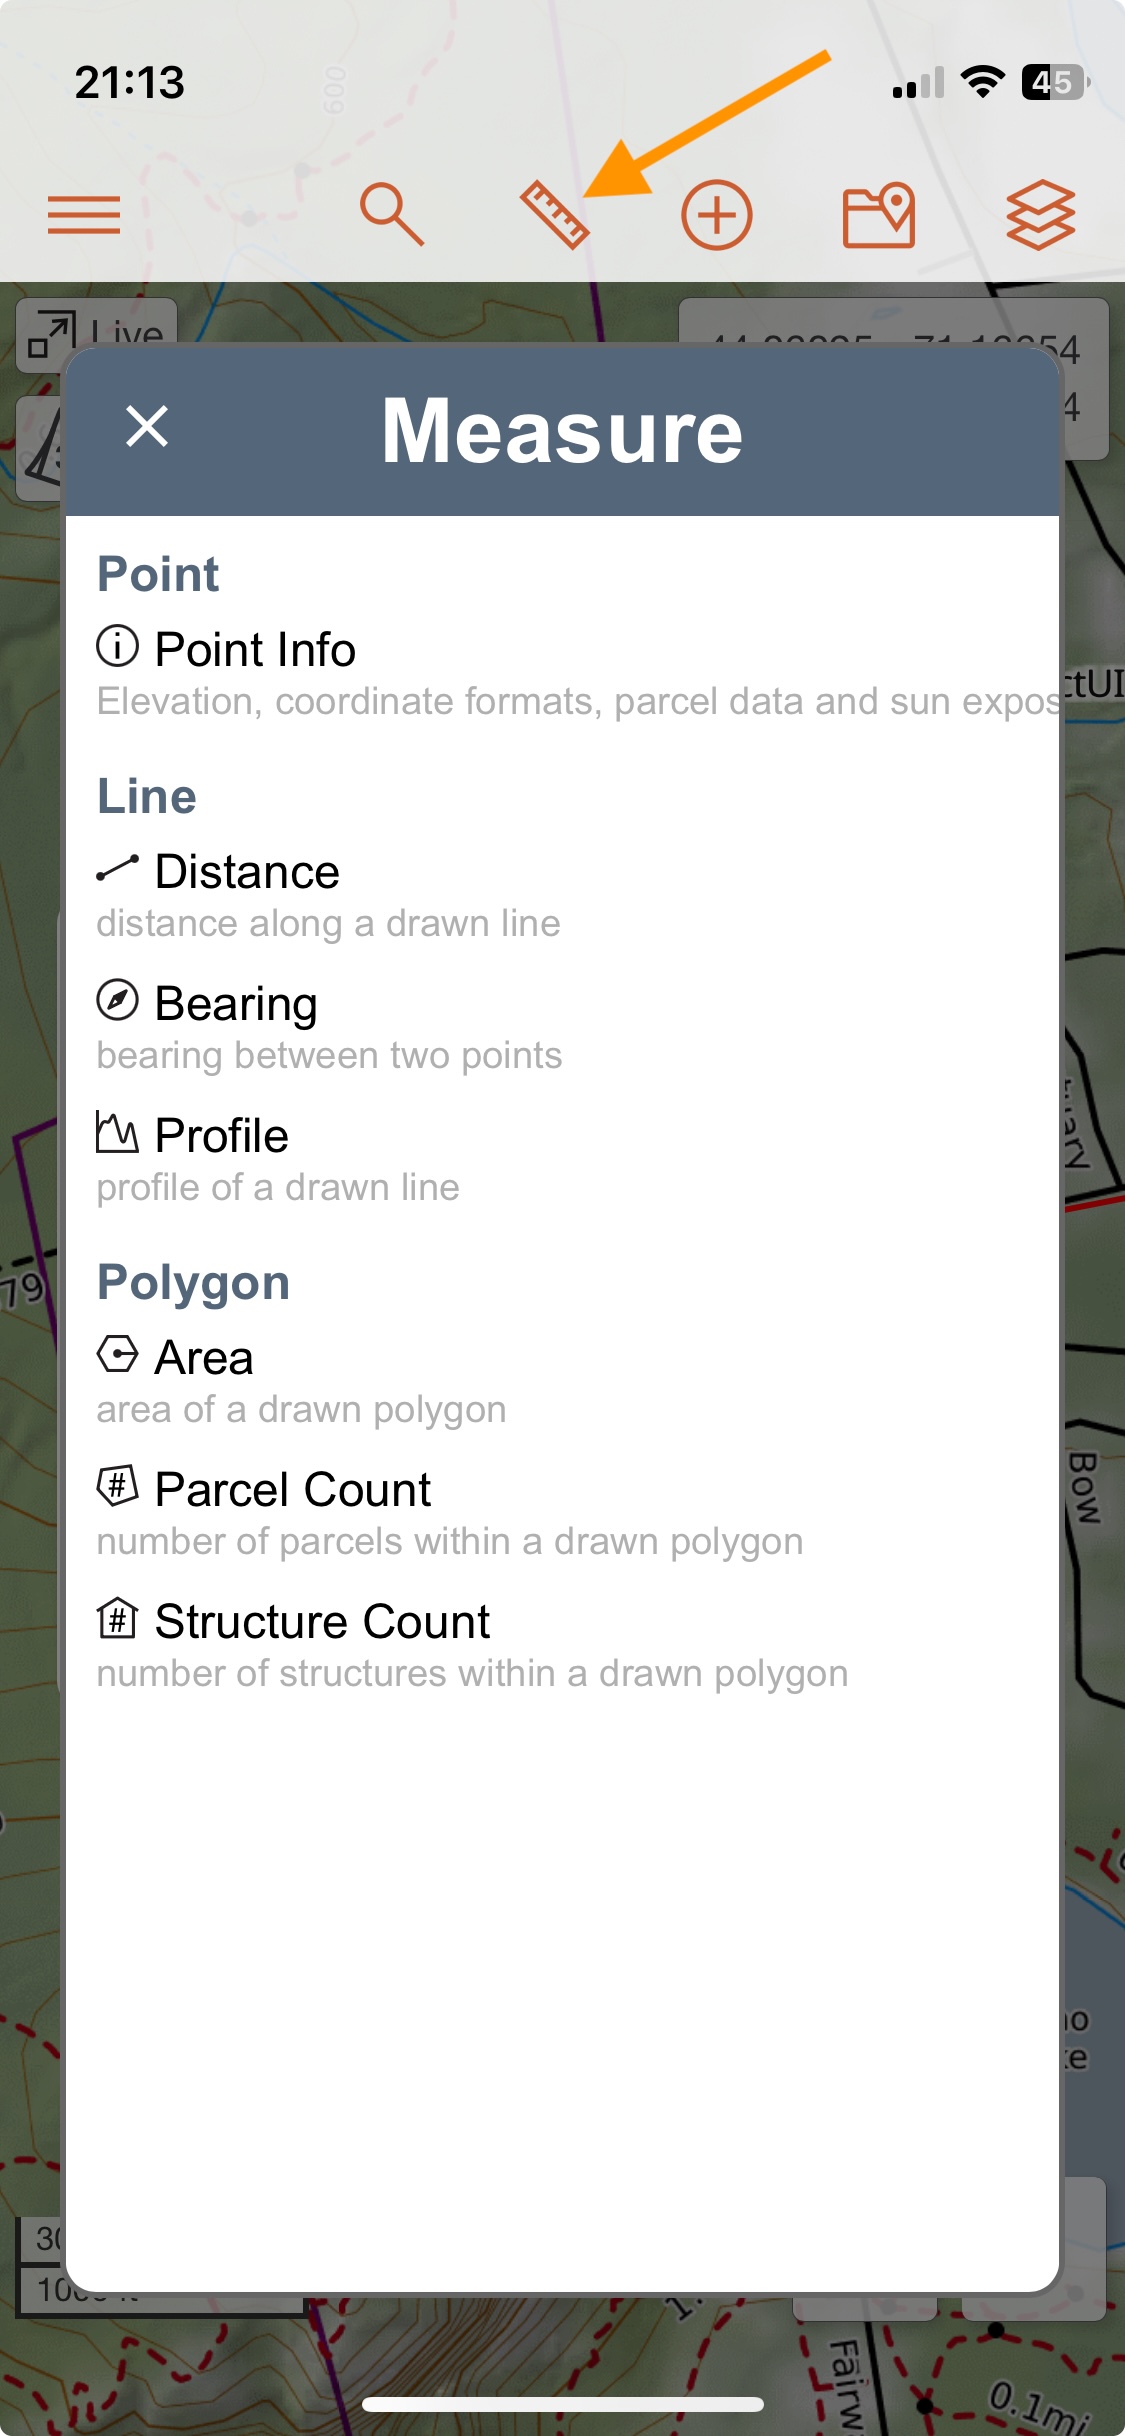
The Measure menu is divided into three sections based on the types of objects you can draw on the base map: point, line, and area. Each section contains tools designed to help you learn more about the area you're viewing. Let’s take a closer look at how each of these tools works.
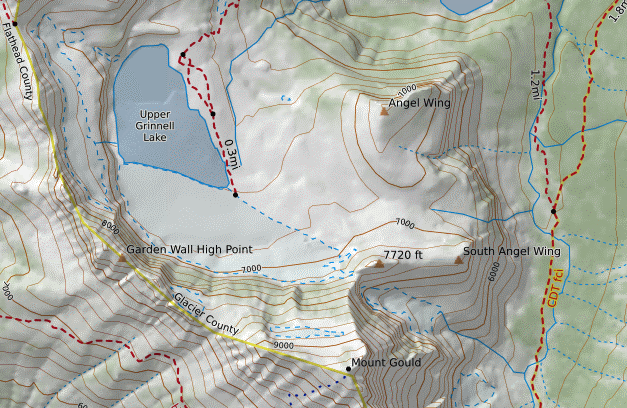
Point Info
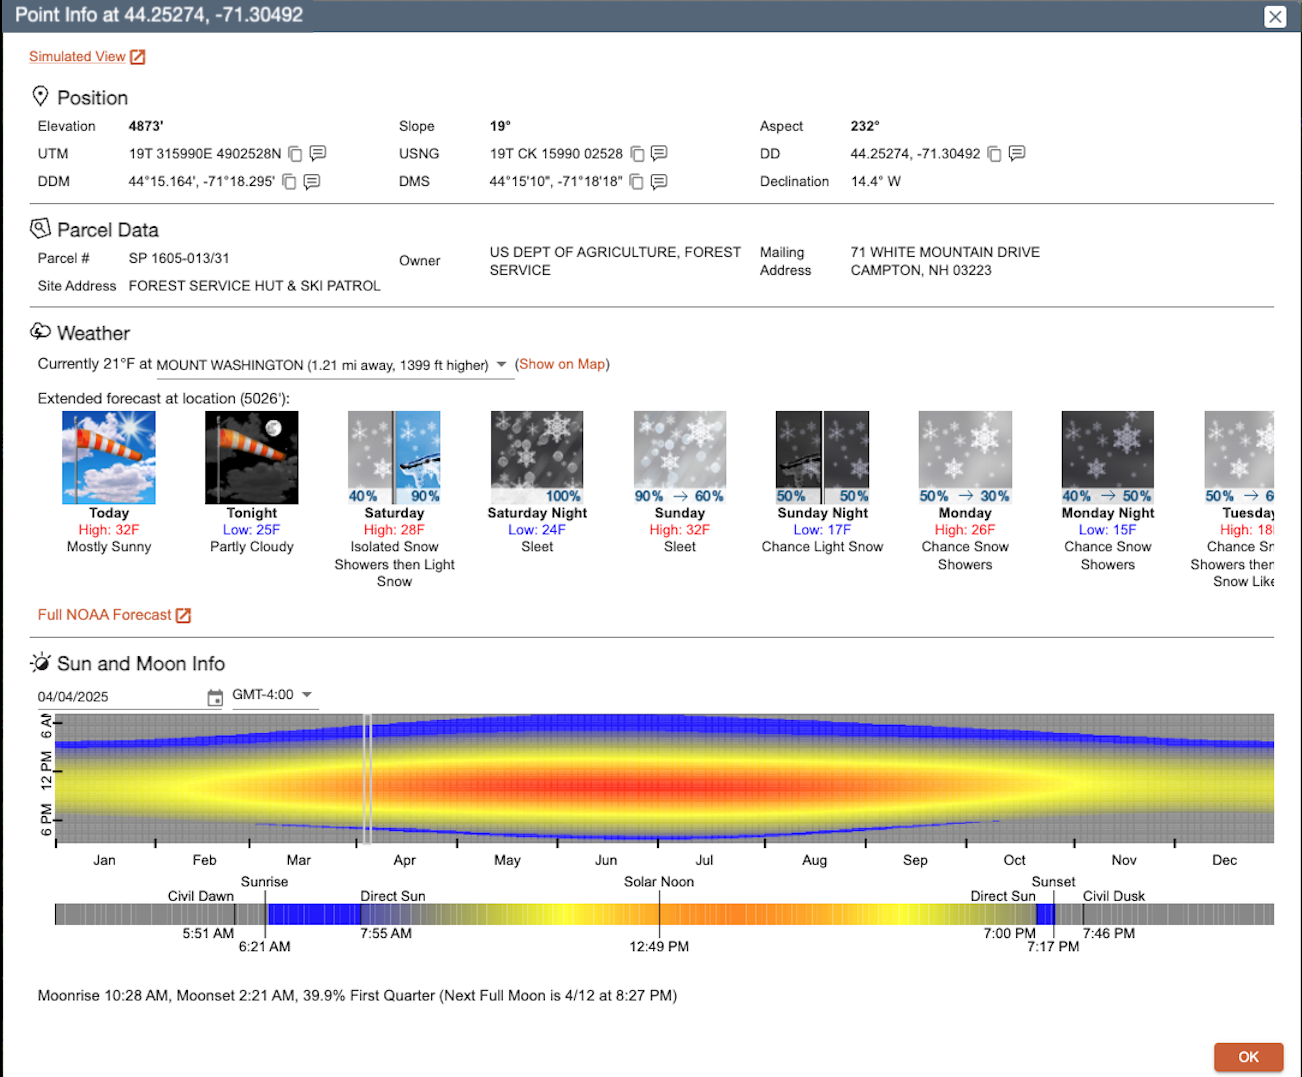
Once you’ve selected the point, a dialog will appear displaying details such as a simulated view link (web only), elevation, slope, aspect, coordinates, and declination. The point forecast link and sun and moon data (including intensity, phase, and rise/set times) are also available to all users. With a Pro or higher subscription, additional information may be shown, including parcel details (like site address and owner) and current weather conditions.
Simulated View Link (web only)
At the top of the box that opens when you click Point Info is a Simulated View link. When you click this link your browser will open a new tab. In that new tab what you will see is a simulated view of what you would see if you were standing at that point on a map. This tool brings up a simulated 360° view from the selected point with options for customizing your view. Simulated View is only available on the web.
In the upper right-hand corner, you can choose between Wireframe, Imagery, Topo, Wireimagery, and Wiretopo. Please note that not all options are available in every location. The Topo option uses our Scanned Topo layer, which is only available where scanned topo maps exist. The Imagery option is limited to areas with high-resolution imagery and is currently only available in the contiguous United States (the lower 48).
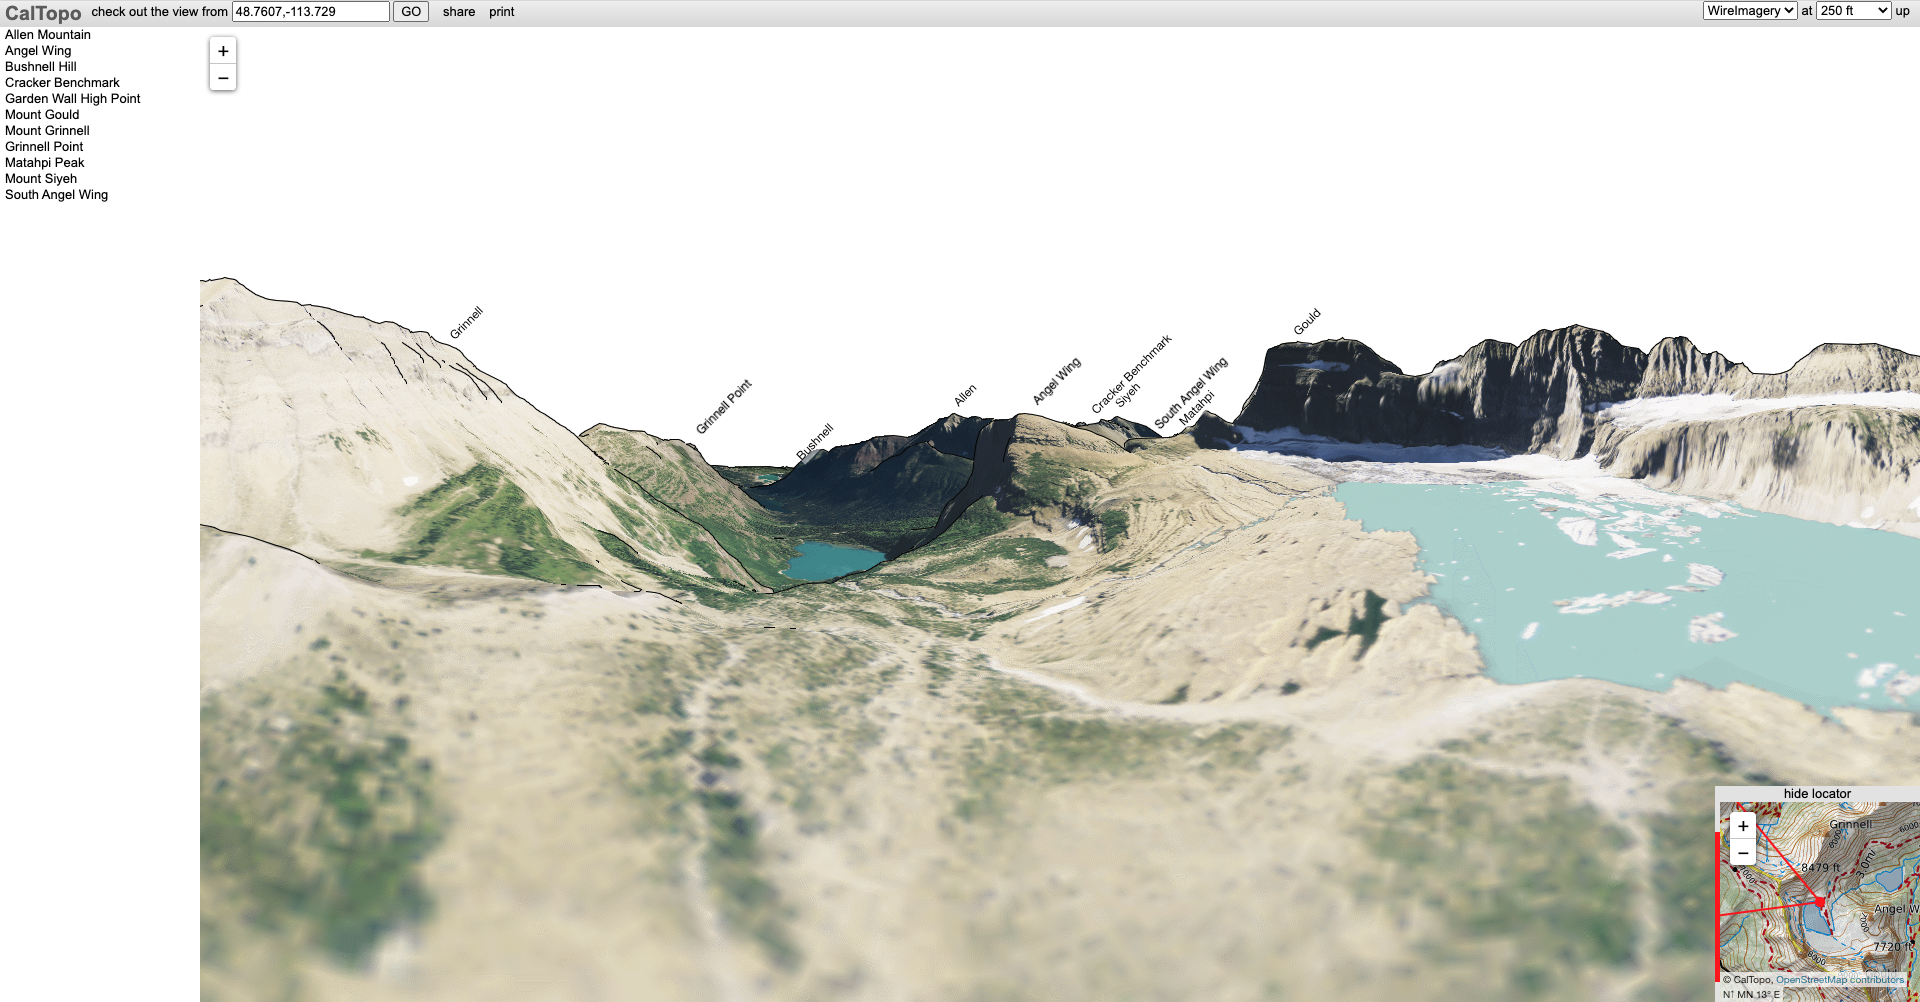
Clicking Simulated View opens a new tab with a default wide angle view to the north.
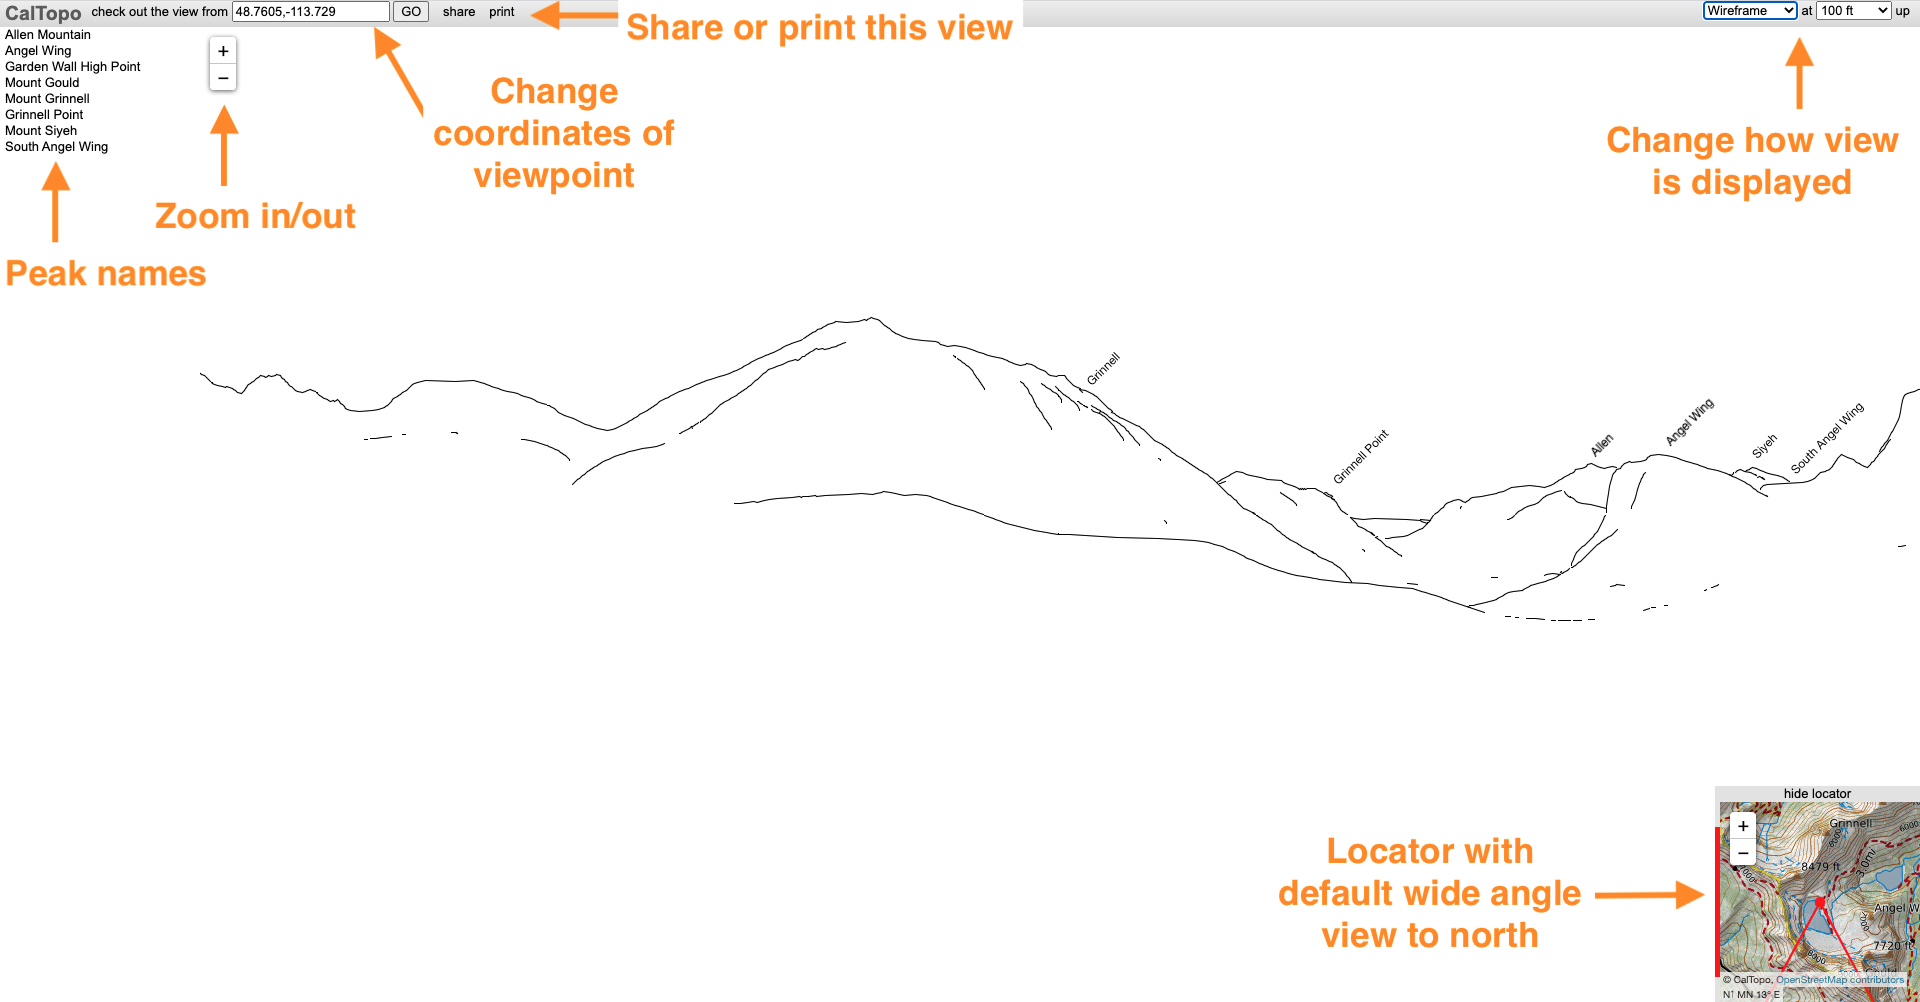
The locator in the lower right corner shows where you are on the map and the direction you are viewing. You can click and drag to raise or lower the view and look side to side. You can also zoom in and out using the plus and minus buttons in the upper left corner or the zoom functions on your trackpad or mouse. The locator will reflect any changes you make to your view. Click *hide locator* to hide this box.
By default peaks are labeled and shown in wireframe 100 ft from the ground. You can adjust these settings in the upper right corner using the appropriate dropdown menus.
Peaks are listed on the left-hand side. Clicking on a peak name will center the view on that peak. You can also manually adjust your viewpoint by entering new coordinates in the search bar.
You can easily share or print your view. Use the *Share* button to obtain a shareable URL of your view. Clicking *Print* opens *Print This View*.
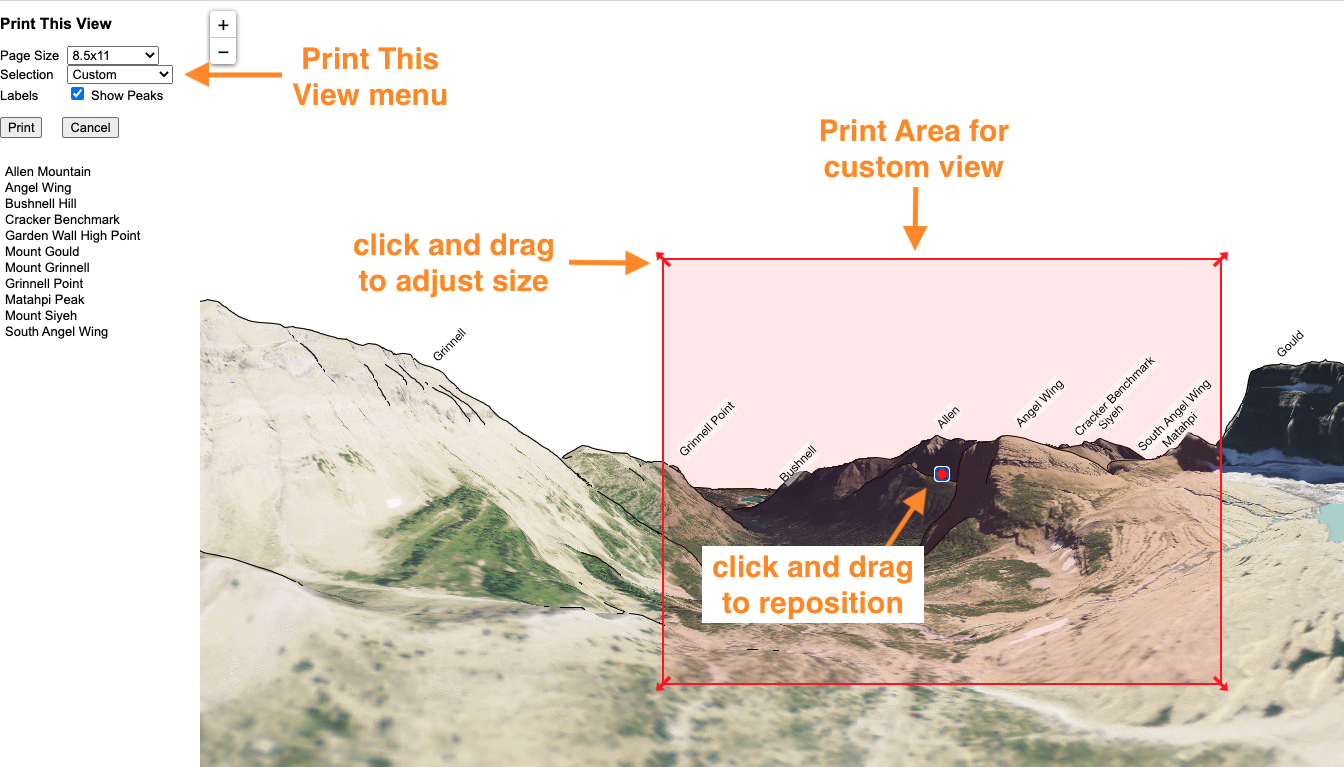
In the *Print This View* menu on the left, select your page size, whether you want a custom view or full panorama and whether you want peaks labeled. If you choose a custom view, a red print area will appear on the view. Adjust the print area by clicking and dragging the center dot to move the entire print area and clicking and dragging the arrows at the corners to change the size of the print area. When you are happy with your selection, click *Print* to generate a PDF that you can save to your computer or send to your printer.
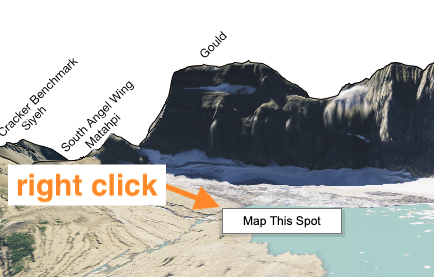
If you see a spot on the view that you would like to pinpoint its location, right-click the spot on the view and then click *Map This Spot* to display a map of the location in a new tab.
Position
Under Position, the first line of information displays the elevation, slope angle, and aspect. You’ll also see the coordinates in all the formats we support. Clicking the Read As icon shows how to verbalize the coordinate for radio or voice communication. Finally, the Declination is listed at the end of the coordinate list.
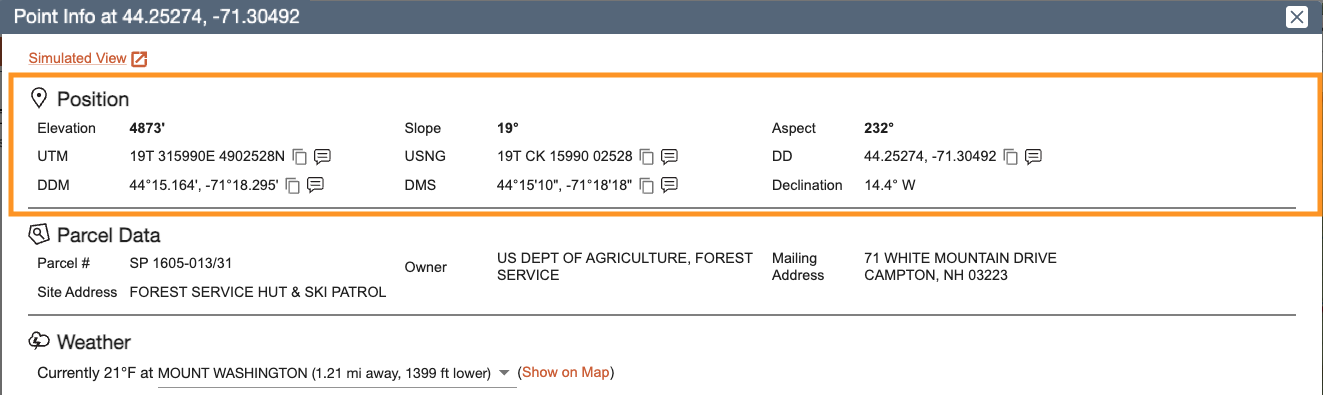
Parcel Info
For users with a Pro subscription or higher, the next section includes Parcel Data. This data includes the parcel number, site address, owner, and mailing address (where available). Data for this tool comes from ReGrid.
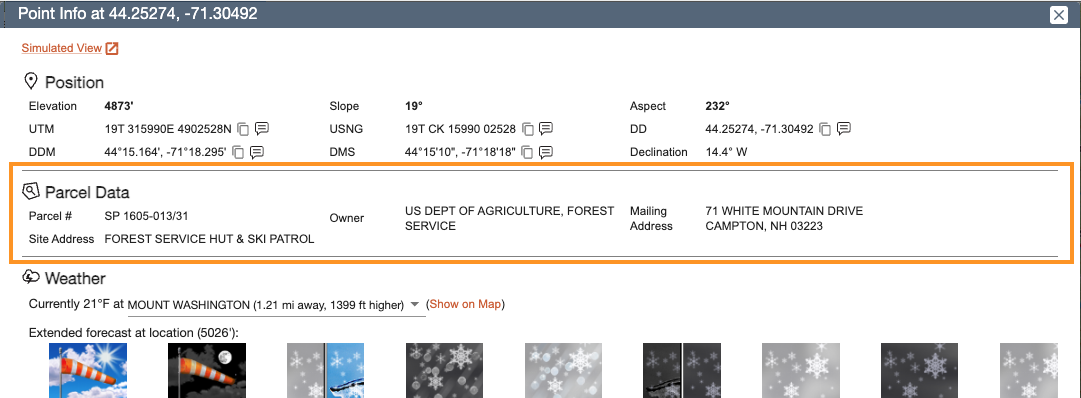
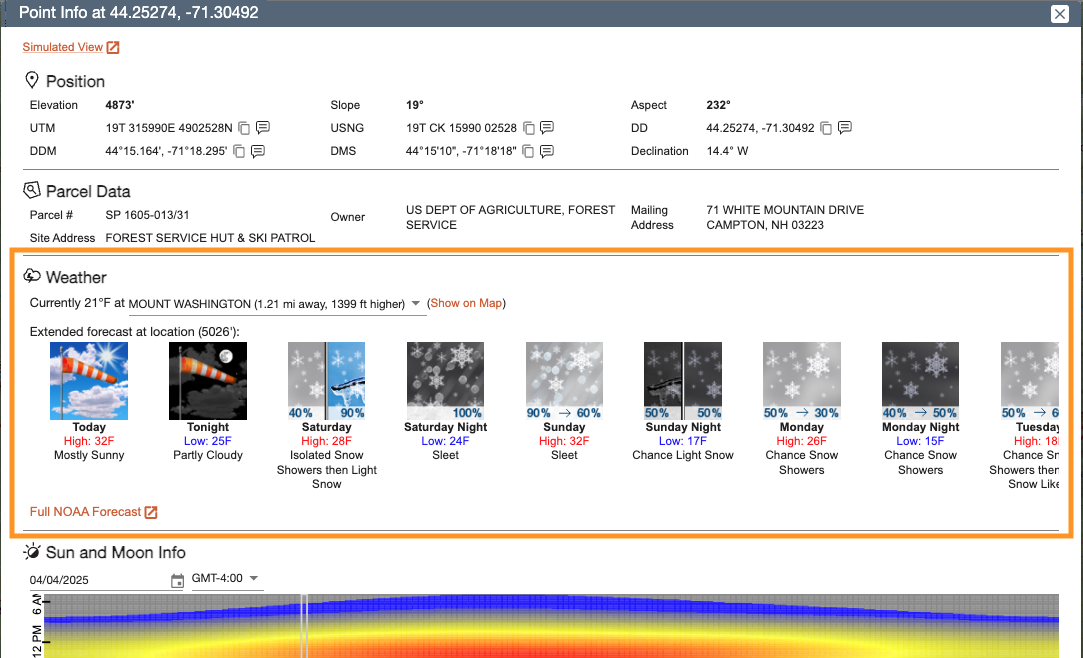
Weather
The weather data is divided into three sections. The first section, available to users with a Pro subscription or higher, displays current conditions from the nearest weather reporting station. A dropdown lets you select other nearby stations as well. This section includes the current temperature, station name, distance from your selected location, and the elevation difference between the two. At the end, there’s a link to view the station on the map. Clicking it will close the Point Info dialog, center the map on the station, and open its data.
The second section displays icons from the 7-day NOAA point forecast, showing upcoming weather conditions at the selected location.
The final section includes a link to the full 7-day NOAA forecast, which will open in a new browser tab.
Sun and Moon Info
When the Point Info dialog opens, you’ll see a colorful graph near the bottom. That graph shows the sun’s intensity throughout the year at the selected point. The horizontal axis represents the time of year, and the vertical axis shows the time of day—based on your computer’s current time zone.
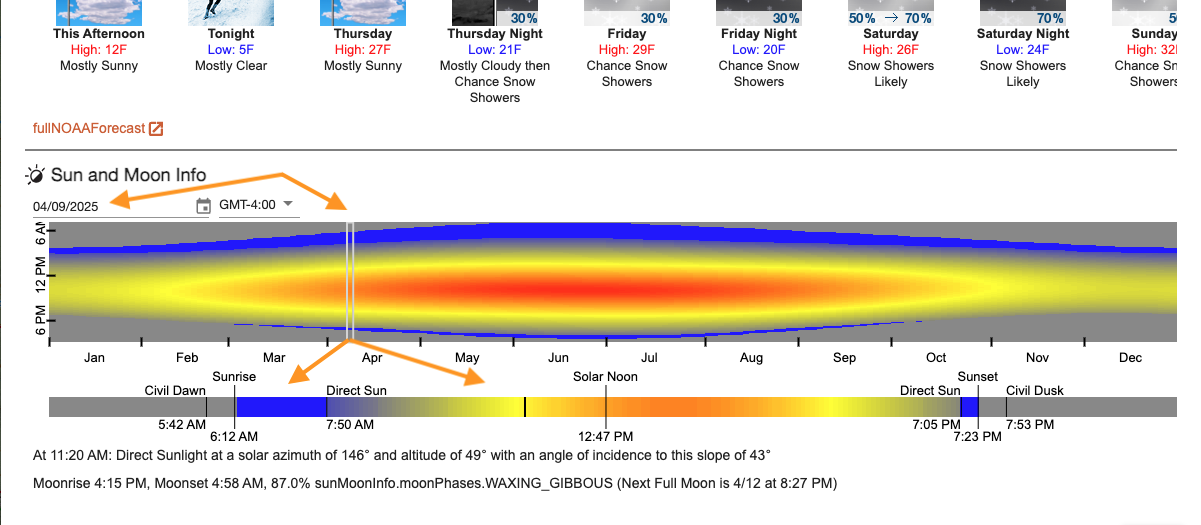
You’ll notice a vertical line on today’s date, which is displayed in the top-left corner of the graph. You can slide that line left or right to change the date.
If the location isn’t in your current time zone, you can adjust the graph using the + or - hours from GMT, located next to the date.
Below that graph is another one—essentially the vertical line from above, laid on its side. It shows the progression of the day at that location, with markers for Civil Dawn, Sunrise, First Direct Sun, Last Direct Sun, Sunset, and Civil Dusk.
As you move your cursor across this lower graph, you'll see values update just below it. These include:
- Time – the specific time you're hovering over.
- Solar Azimuth – the compass direction of the sun, measured in degrees.
- Solar Altitude – the height of the sun in the sky, in degrees above the horizon (0° is right at the horizon, 90° is directly overhead).
- Angle of Incidence – the angle between the sun’s rays and the ground. A value of 0° means the sun is hitting the surface directly—when sunlight is strongest and most efficient. A 90° angle of incidence means the sun’s rays are skimming along the surface, delivering very little energy.
Below the sun intensity information, you’ll find details about moonrise, moonset, the moon phase for the selected date, and the date of the next full moon.
Line Measurements
The tools below are available for both lines and polygons unless otherwise indicated. To learn more about a line, you can choose to measure distance, take a bearing, generate an elevation profile, or look at terrain statistics. For a polygon you can find the area of that polygon, analyze terrain statistics, or count the number of property parcels in that area.
Upon selecting a tool from the menu, the cursor will turn into crosshairs and you can then draw your line or polygon the same way you would when adding a map object to your map. For information on drawing a line or polygon, go to the Lines and Polygons lesson. Double click to end your line or polygon and then the requested information will be displayed in a dialog.
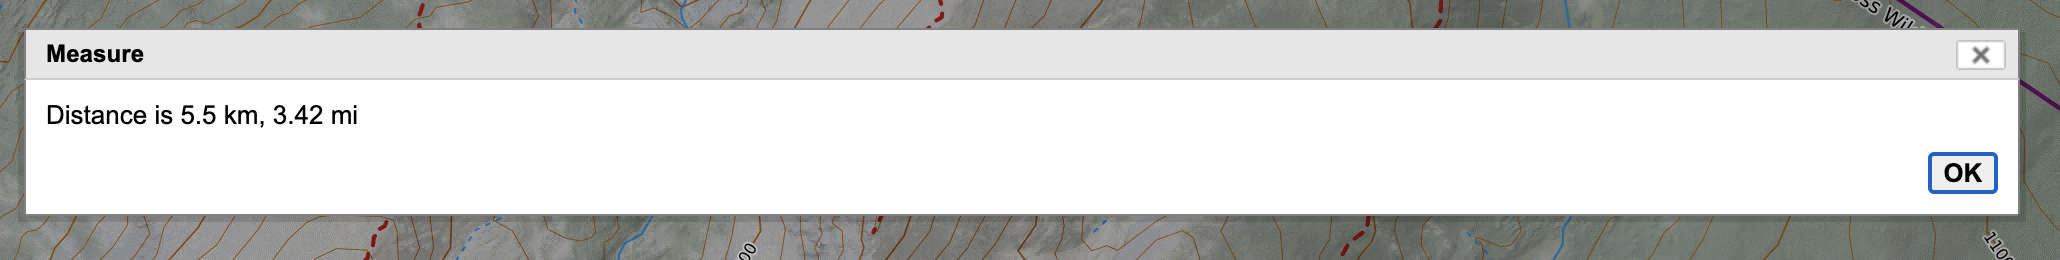
Distance
When you need a quick assessment of the total distance along a line, use this tool. Draw a line as you normally would and then double click to end the line. This will bring up a dialog with the total distance of the line.
As you are drawing the line and adding vertices, watch the upper right hand corner of the map viewer. It will display the bearing from the last vertex you added for true north (TN) and magnetic north (MN) as well as the current length of the line as you move the cursor around the map.
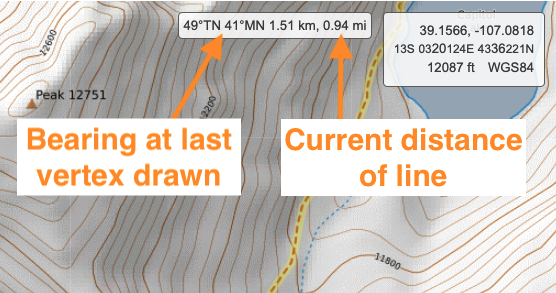
While drawing a line using the distance measurement tool, you get some live data, as indicated here.
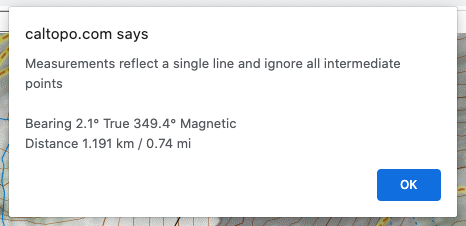
Bearing
If you want to take a bearing or determine the distance between two points only, use this tool. Draw a line as you normally would and this tool measures the distance and bearing (for true and magnetic north) between the beginning and end of the line. Unlike the Measure Distance tool described above, any intermediate points will be ignored.
Profile and Terrain Statistics
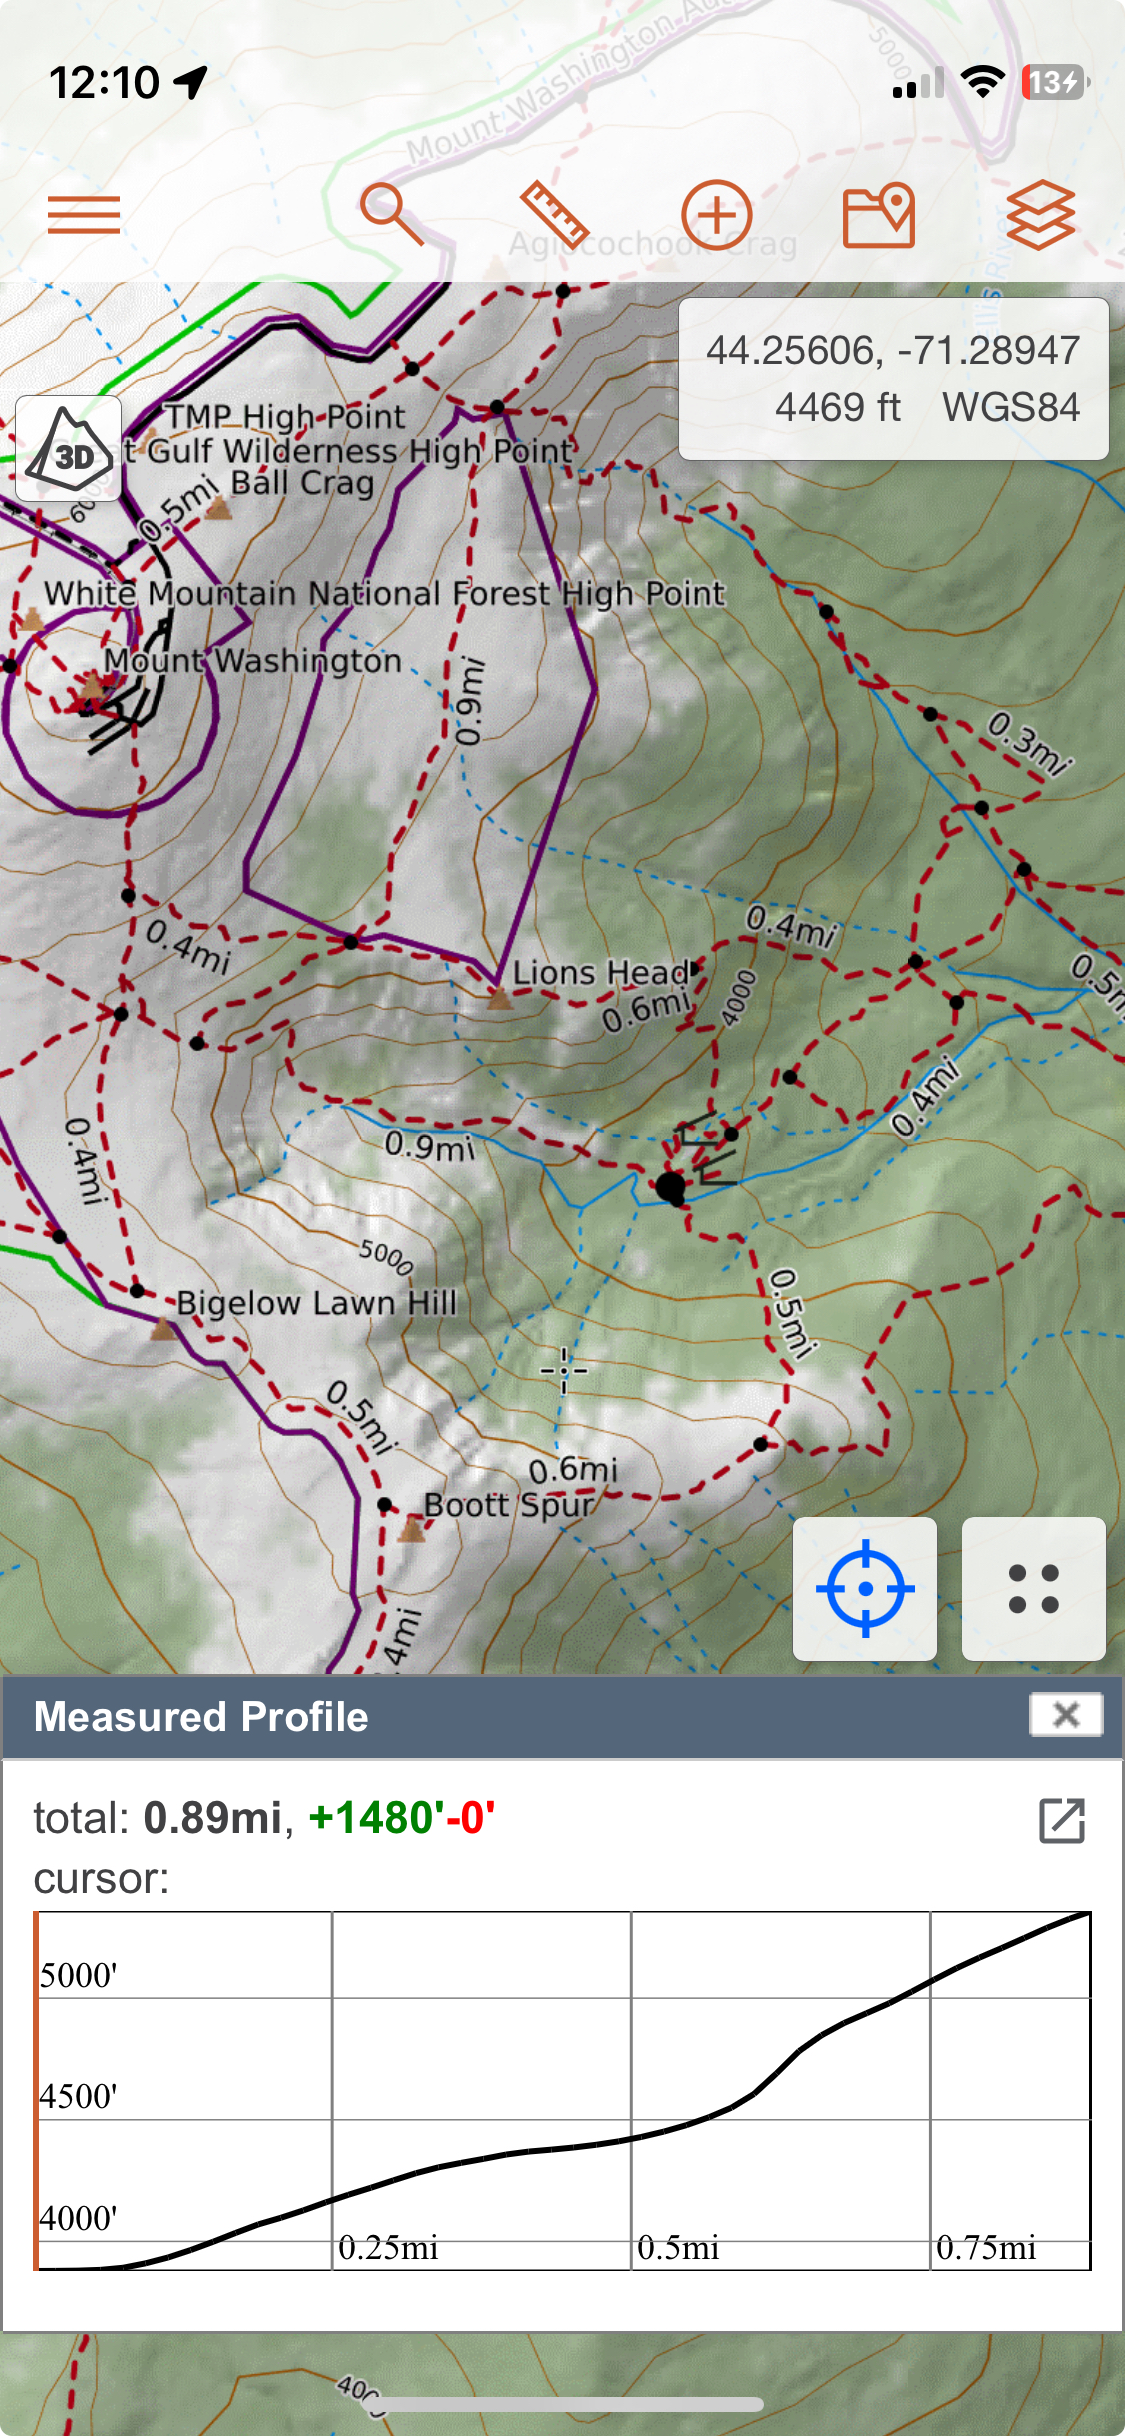
Want to know how the elevation will change as you travel along a potential route? Curious to learn the overall elevation gain and loss? Profile allows you to display this information quickly. Draw a line or polygon and then double click to end and display the profile dialog.
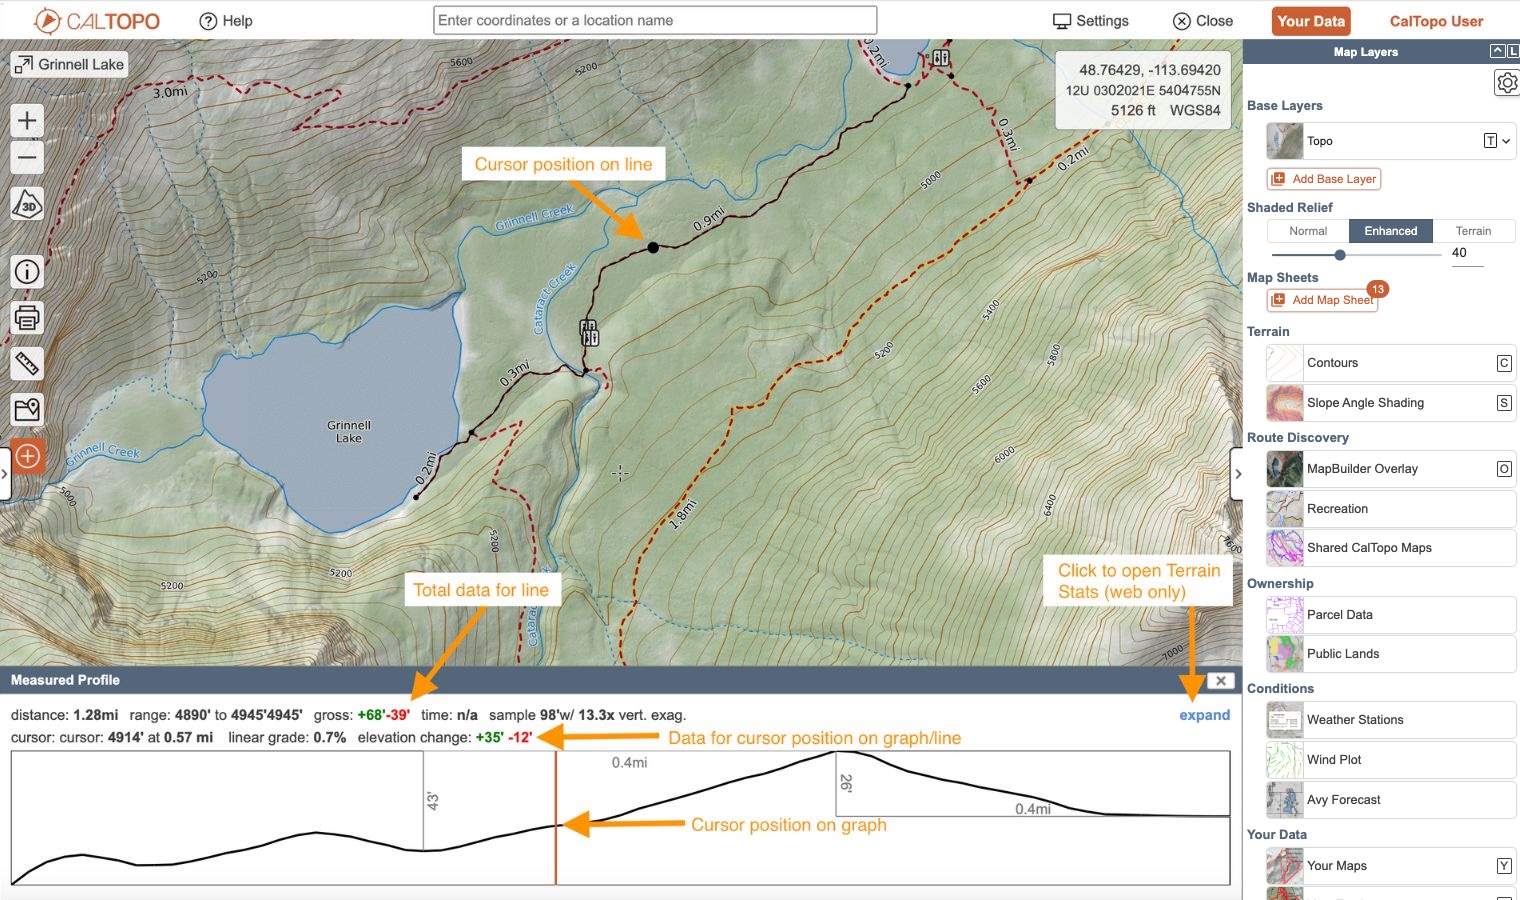
The profile dialog displays the change in elevation over the distance of the line or the perimeter of the polygon drawn. Elevation is on the y-axis and distance is on the x-axis. The top row of information above the graph shows the totals for the measured line, including distance, minimum and maximum elevation (web only), and overall elevation gain (in green) and loss (in red) of the measured line. The sampling interval and vertical exaggeration of the profile are also identified on the web.
This tool displays an interactive graph that shows the change in elevation over the distance of a line or the perimeter of a polygon.
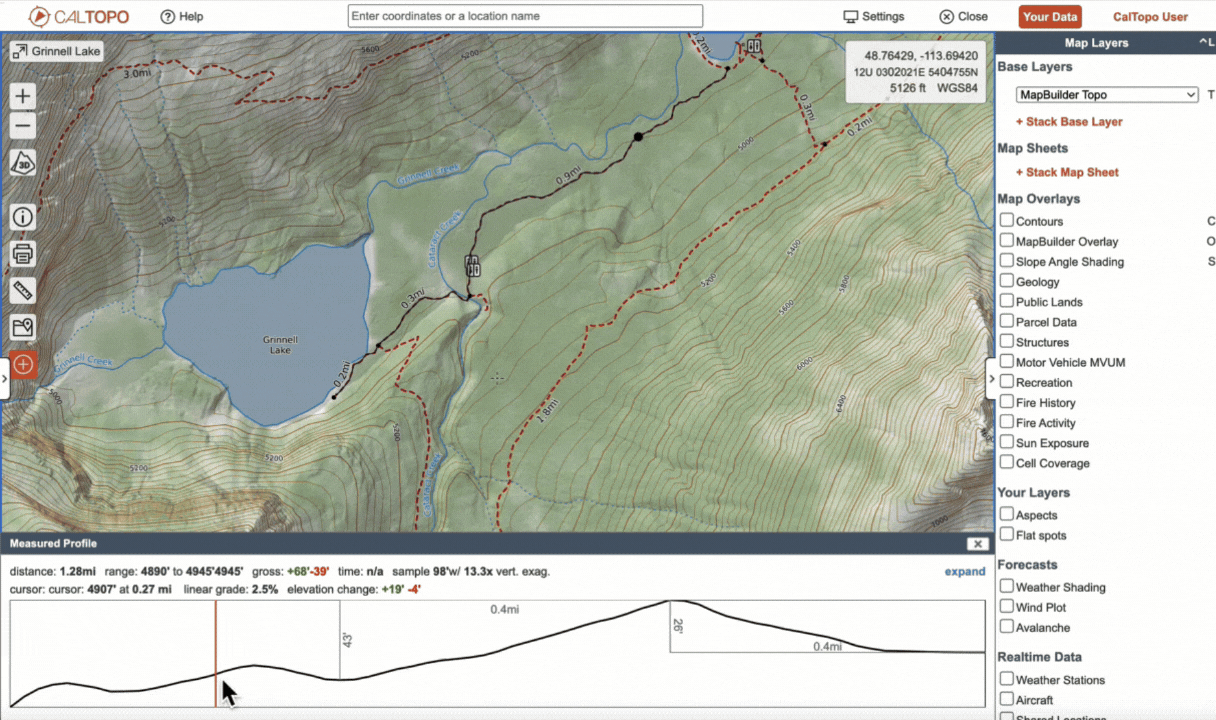
Mousing or dragging your finger over the graph displays a second row of information that shows data for the cursor position on the graph/line, including elevation and distance, linear grade, and the elevation change (in both gain and loss) up to the cursor position. The position of the cursor is also represented on the map viewer by a dot moving along the line, showing exactly where you are on the map.
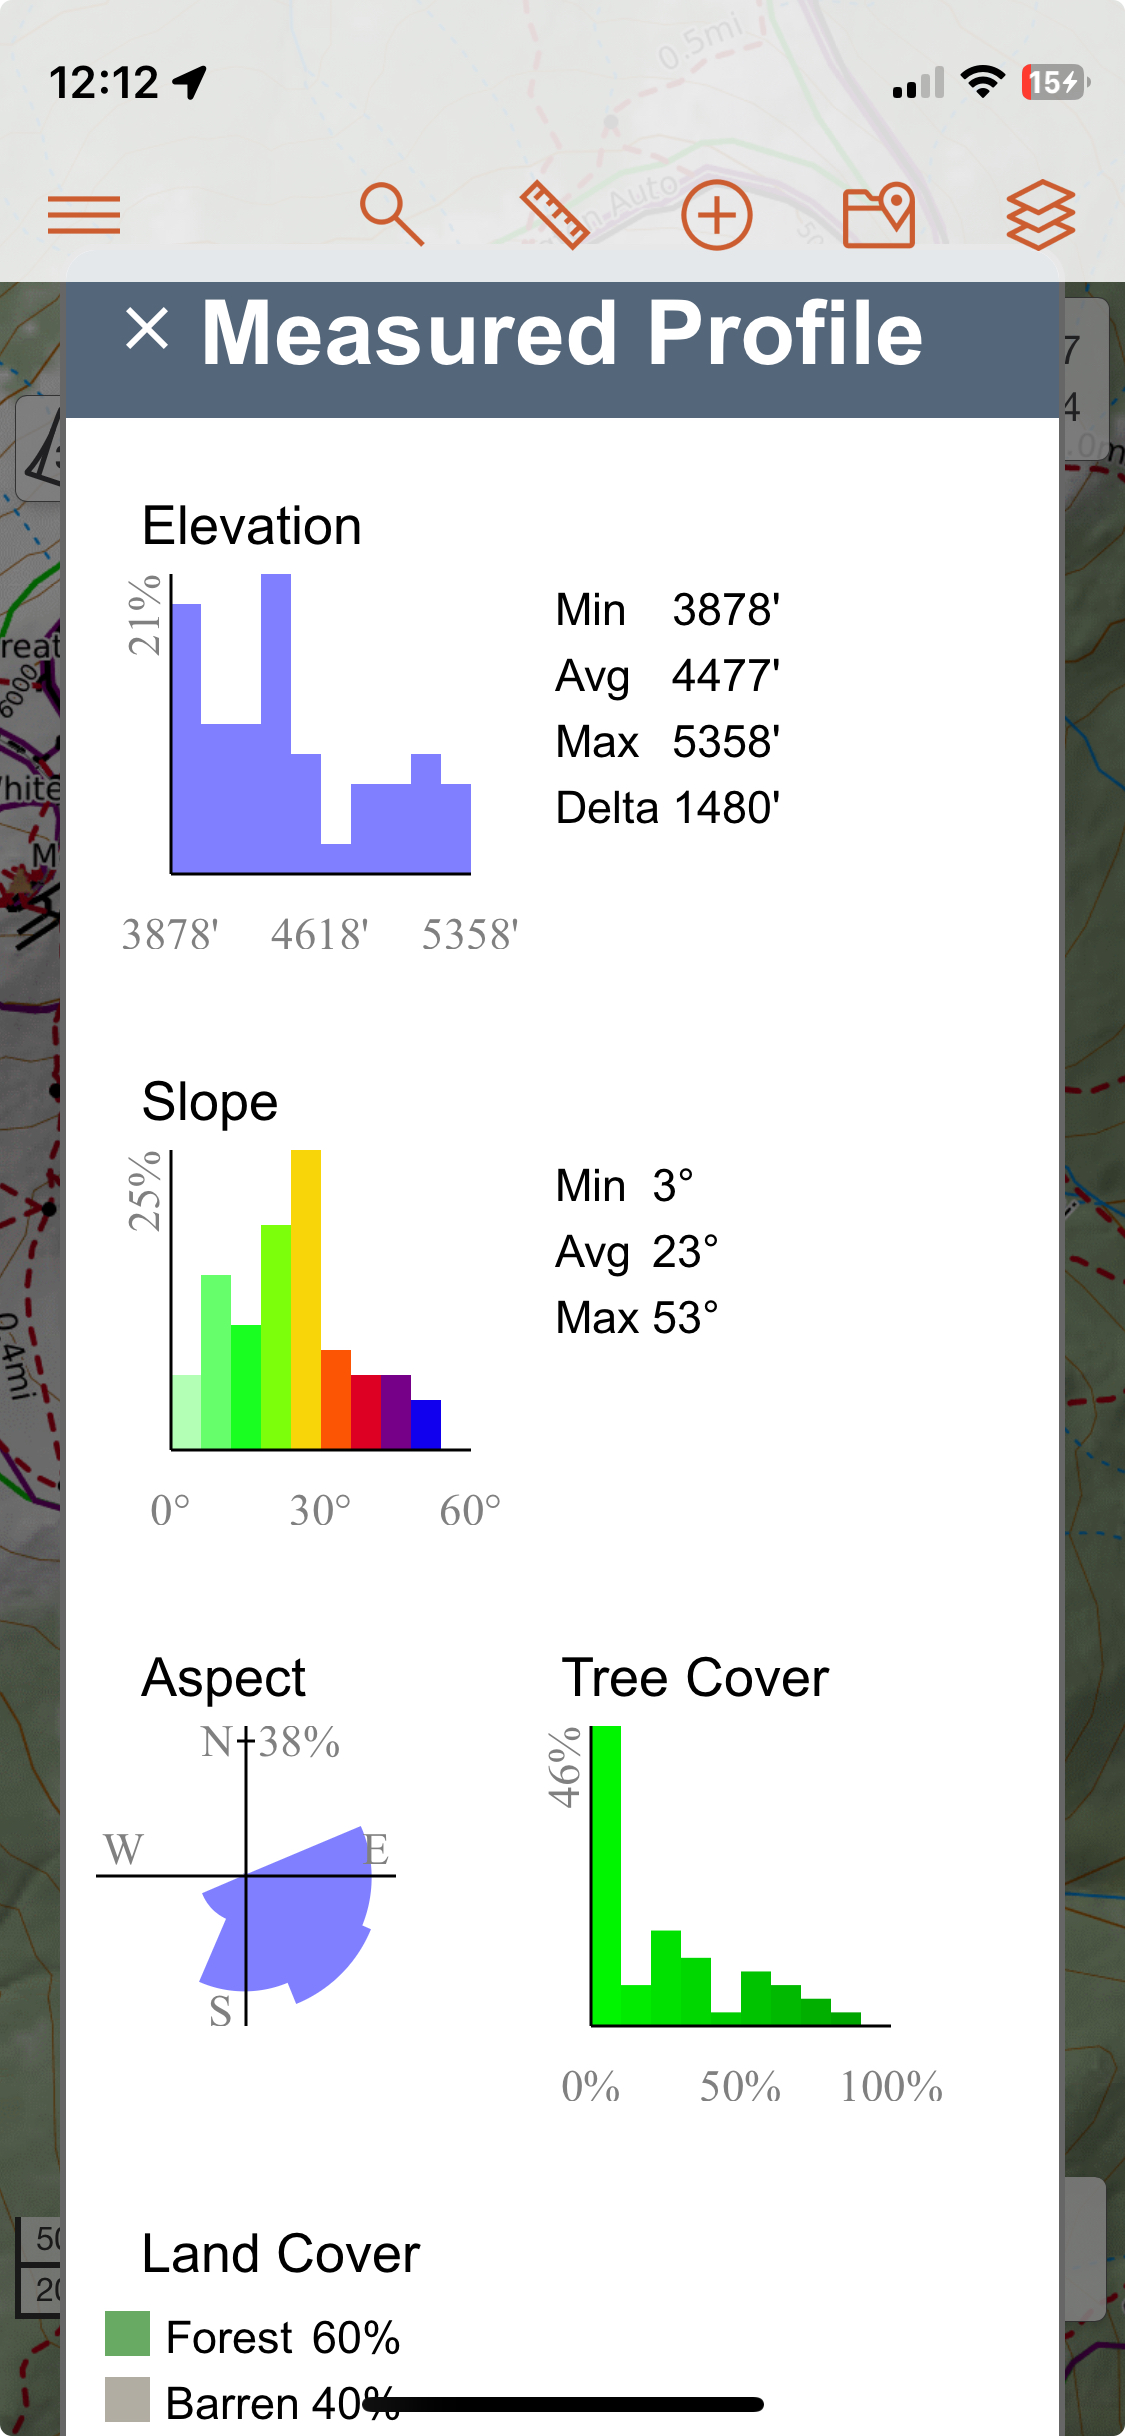
On the web, clicking Expand in the profile dialog will open the expanded elevation profile. This displays terrain statistics for the line or perimeter of the polygon below the elevation profile which is no longer interactive.
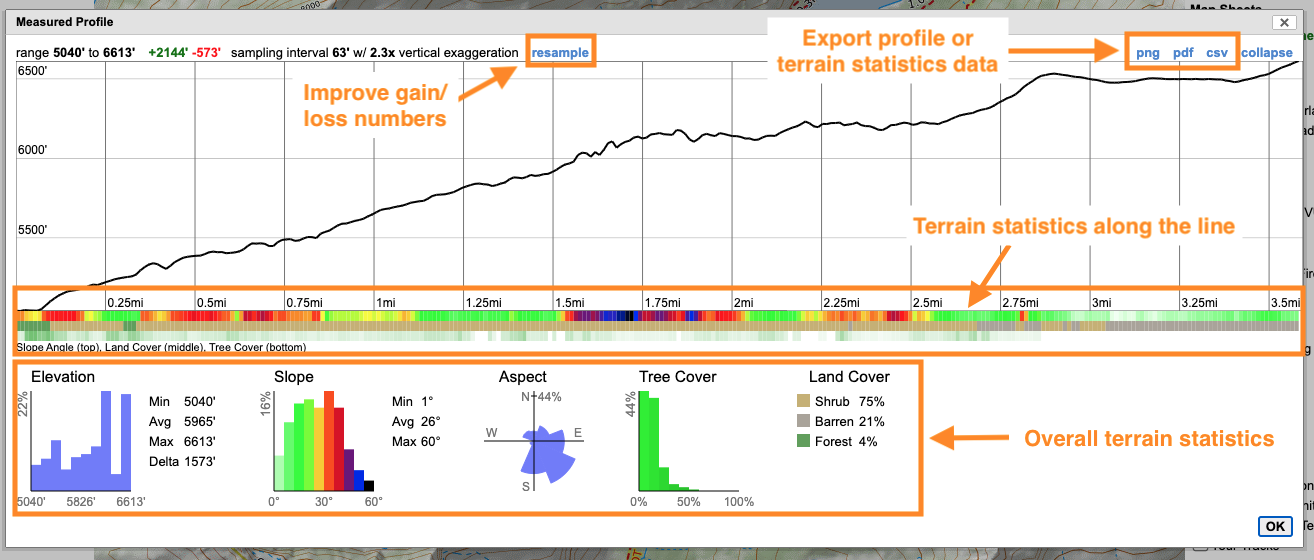
Regarding the slope angle at each pooint on the line, please note that this is not the slope of the line itself. It is the slope angle of the terrain at the geographic point where the line crosses that point.
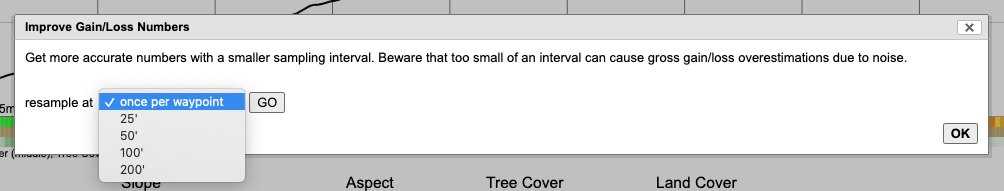
If you have a pro, desktop or team account, you can export this information by different file types on the web:
- png: generate an image of the profile in png file format
- pdf: generate a PDF of all the terrain statistics
- csv: generate a CSV file of the terrain statistics
Clicking Collapse allows you to return to the profile display only.
Using Profile Tool in the Mobile App
Although the Profile tool is very similiar to the web version there are some differences. You cannot Resample, create a PNG, PDF, or a CSV
Polygon Measurements
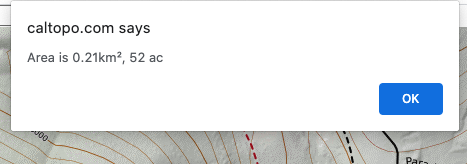
Area
A quick way to find the area of a part of the map is to use this tool. Draw a polygon as you normally would, double click to end and a dialog displays the area of the polygon. Area is shown in acres and is rounded to the nearest tenth.
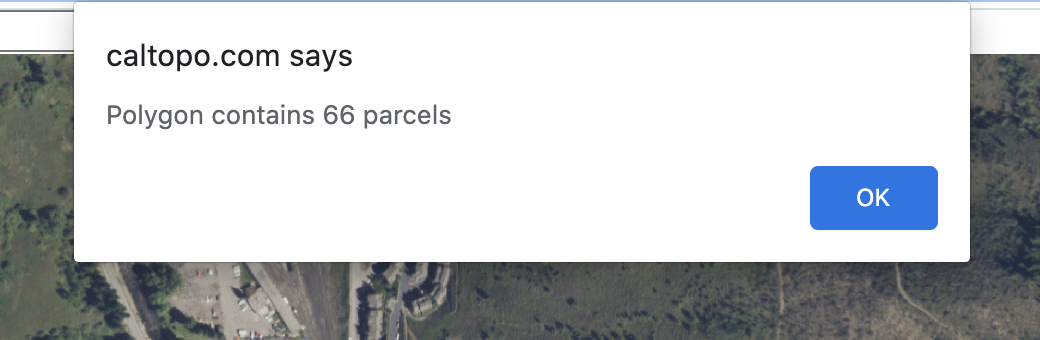
Parcel Count
Do you need to know quickly how many different properties there are in a particular area? Available to pro, desktop or team accounts, this tool allows you to rapidly count the number of parcels contained within a polygon.
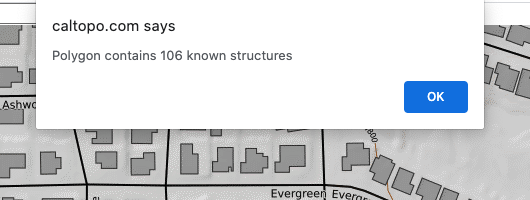
Structure Count
Want to go beyond how many properties are in a particular area and figure out how many actual structures there are? Use structure count to quickly determine how many actual structures are contained within a polygon. Along with parcel count, this tool could be particularly useful for first responders conducting door to door evacuations during a wildfire or other natural disaster.