Base Layer Descriptions
in this lesson
CalTopo offers a wide range of carefully selected base layers. Below are descriptions of each layer. Layers are grouped into the same categories as they appear in the dropdown layer menu.
This lesson covers the standard layers for CalTopo. You may have more than what is listed here if you have added custom layers or belong to a team. Also, you may not have access to all of these layers unless you have the appropriate subscription.
Scroll through or click below to jump ahead to a particular category:
Know which layer you are seeking? Click to jump straight to the layer by name:
- MapBuilder
- Topo
- Hybrid
- Imagery
- MapBuilder Roads Additional Maps
- Scanned Topo
- Forest Servicet
- TF Outdoors
- Open Street Map
- Open Cycle Map
- Additional Imagery
- NAIP Google
- Google Terrain
- Google Hybrird
- Google Satellite
- Google Map Specialty
- Marine Charts
- FAA Sectional
- Historic
- Live Imagery
- Sentinel Weekly
- MODIS Daily
- GOES Live
- GOES Temperature Shaded Relief
- Normal
- Enhanced
- Terrain
MapBuilder
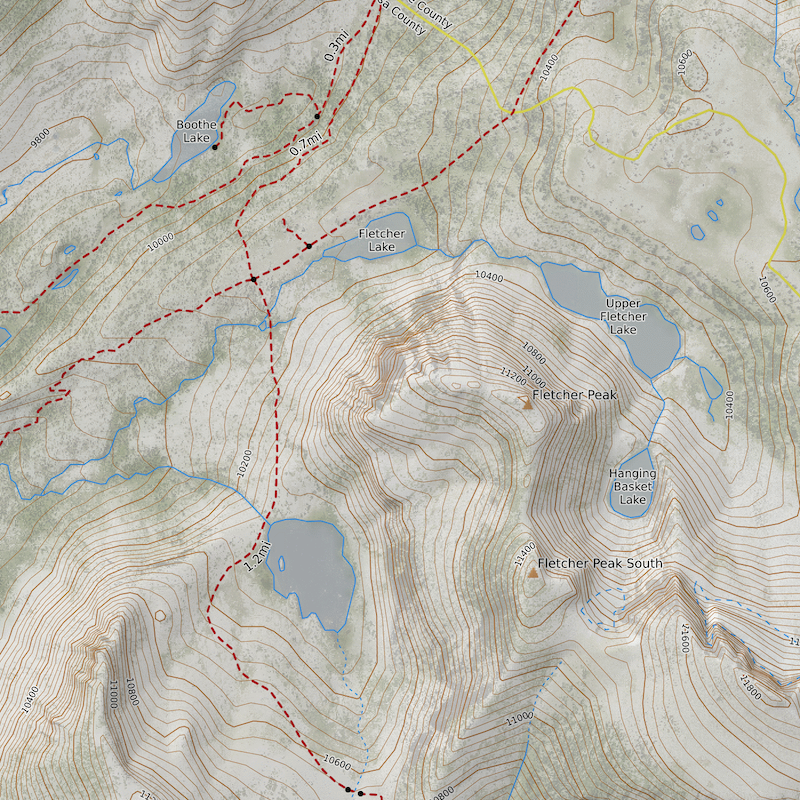
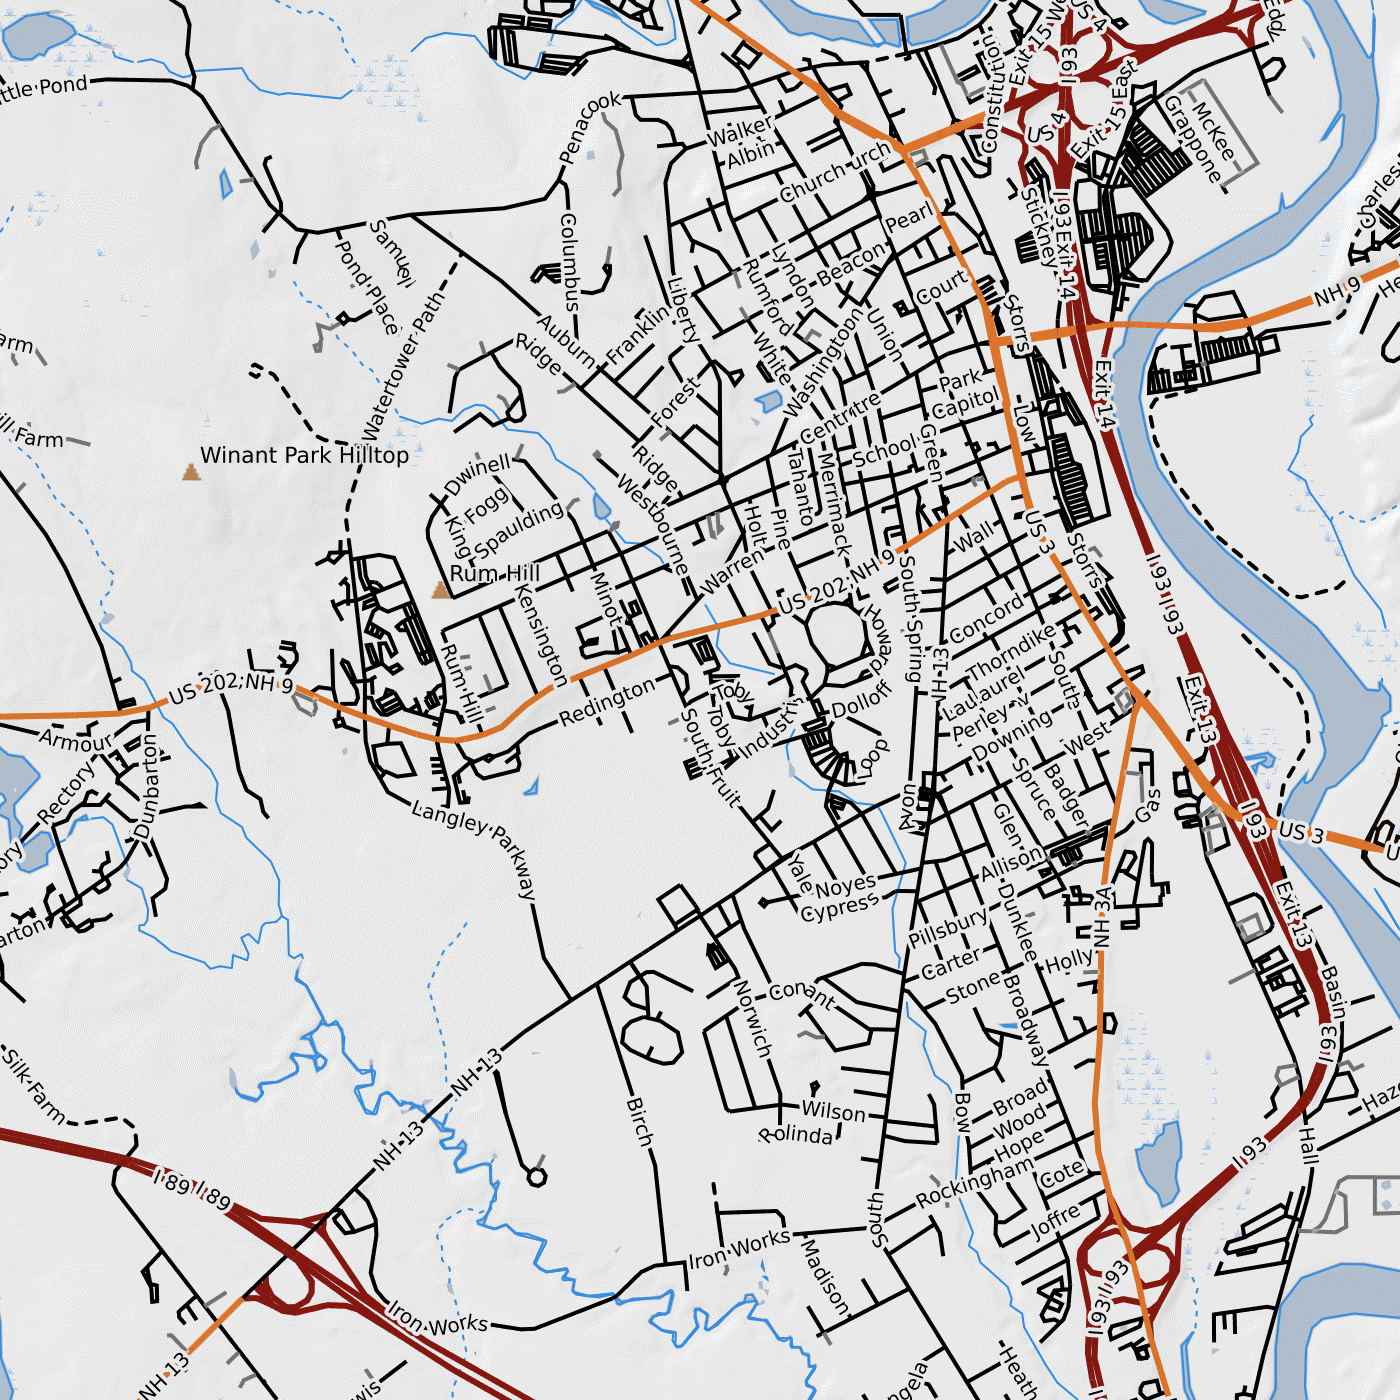
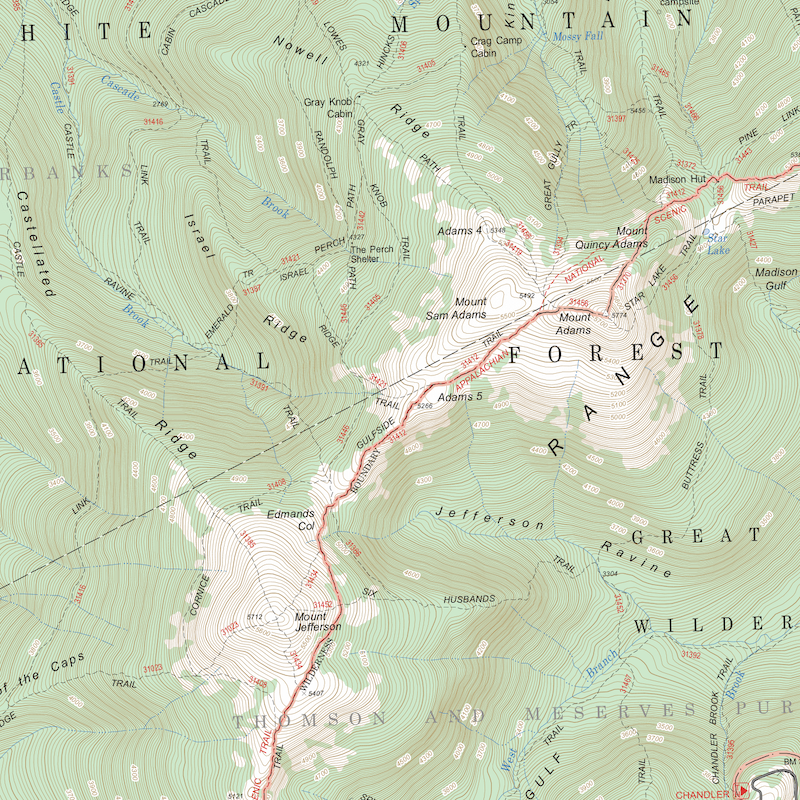
Topo
This is CalTopo’s signature layer. It draws data from a variety of sources, including USGS data sets, OpenStreetMap and high resolution LIDAR (where available). This layer designed to be responsive to zoom level- as you zoom out, less relevant information for that zoom level is removed to reduce clutter and increase ease of use.
CalTopo brings in new data from OpenStreetMap several times a year. To see the most recent import date, please visit the Map Layer Data Updates page.
MapBuilder Topo is a great choice for planning trips that cover large areas or in areas that have undergone lots of new development. However it might not always be the most extensive or up to date base layer in areas that are less traveled or more remote.
Pro, desktop and team account users can create their own customized MapBuilder Topo layer; see the lessons on Building Custom Layers within CalTopo for more information.
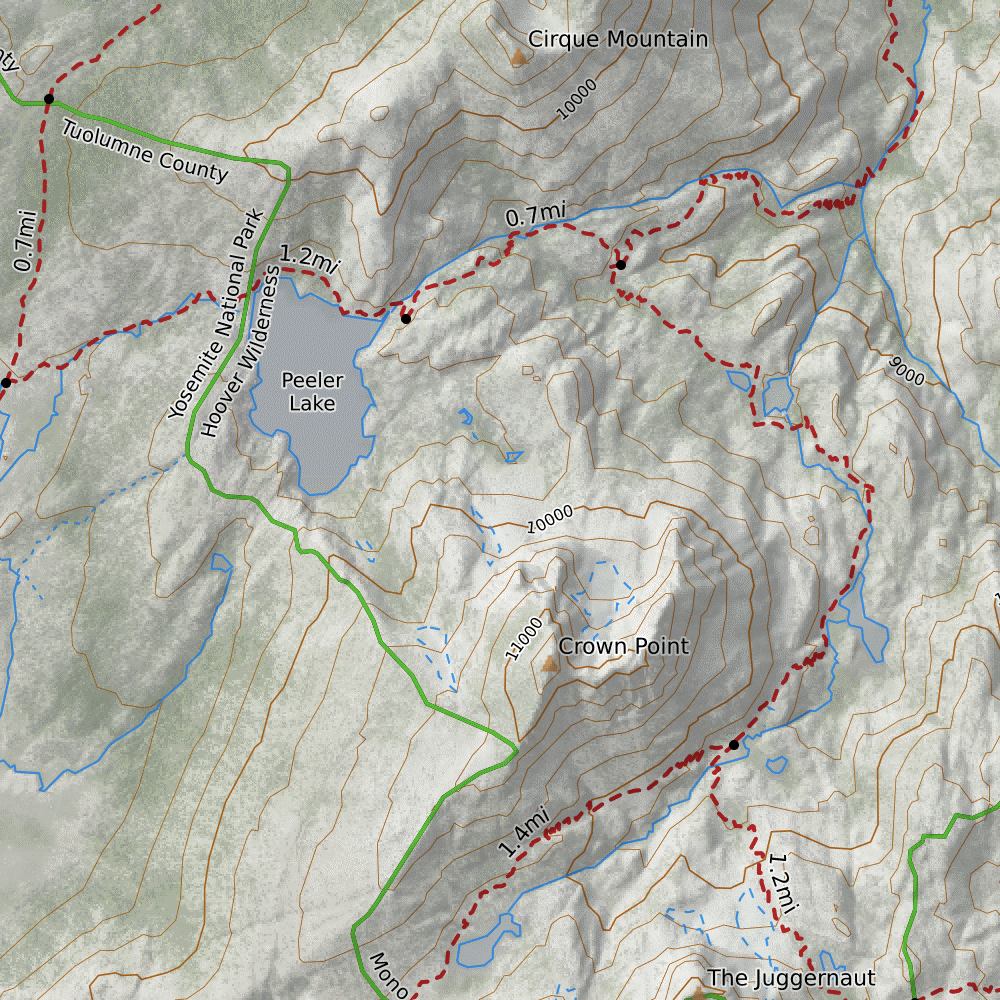
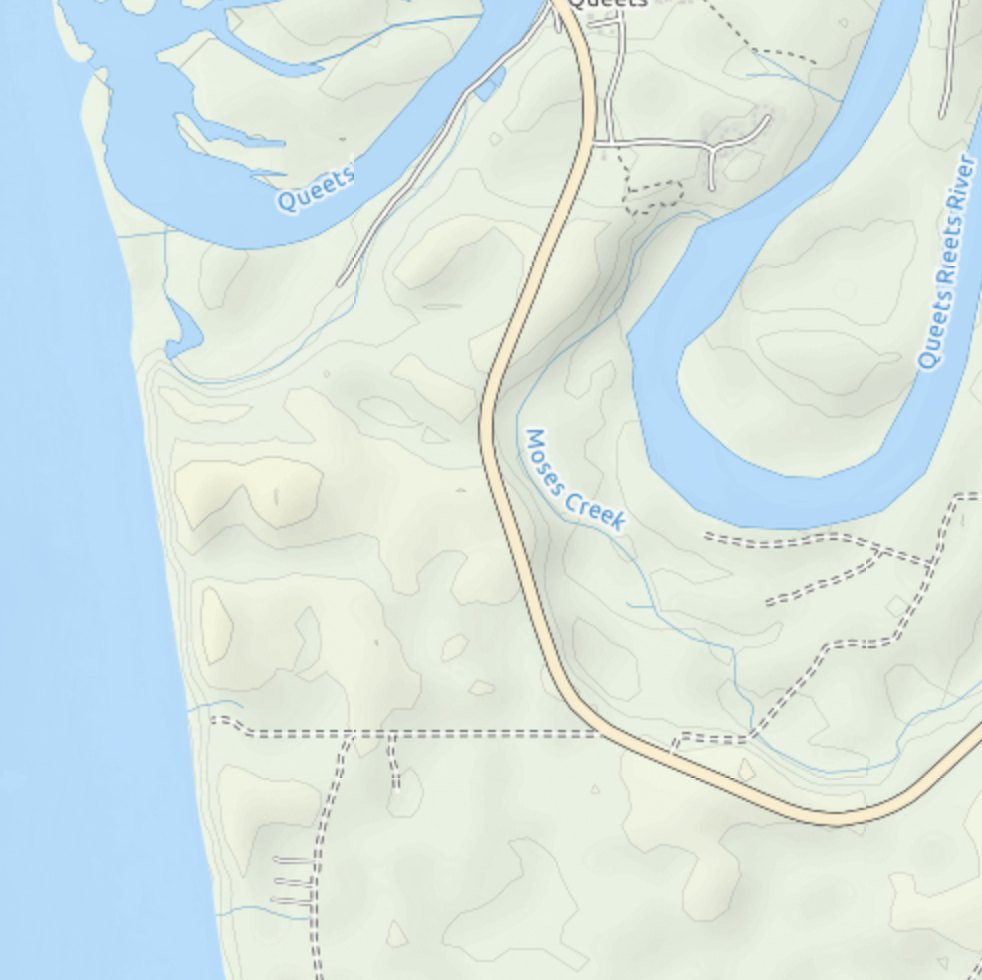
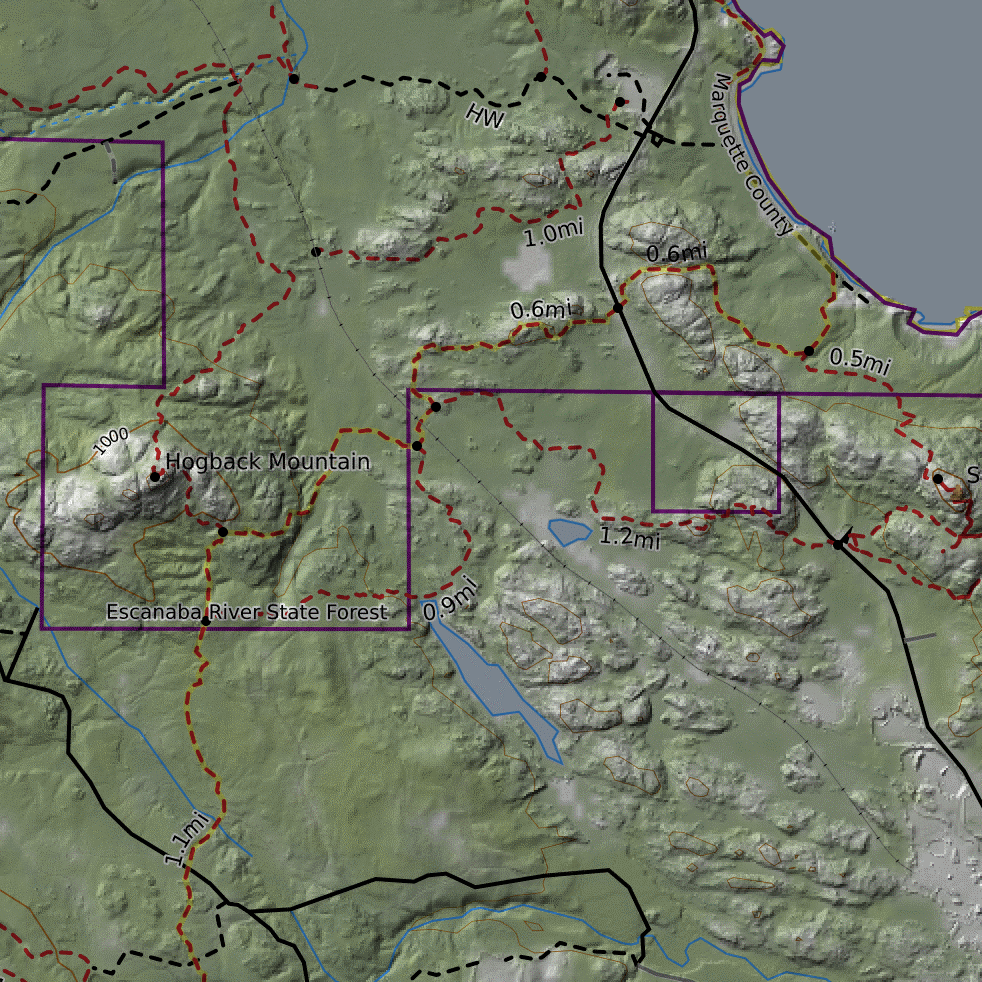
Hybrid
This base layer contains all the data you know and love from MapBuilder Topo plus hybrid shading. Hybrid shading blends the green-gradient shading used by MapBuilder Topo with NAIP aerial imagery, producing a backdrop that shows you much of the detail you’d get from aerial imagery, but with less of the visual noise that makes it hard to pick out other map features.
The toned down aerial imagery base makes this a great layer for comparing tree cover and clearings in relation to trails and contours.
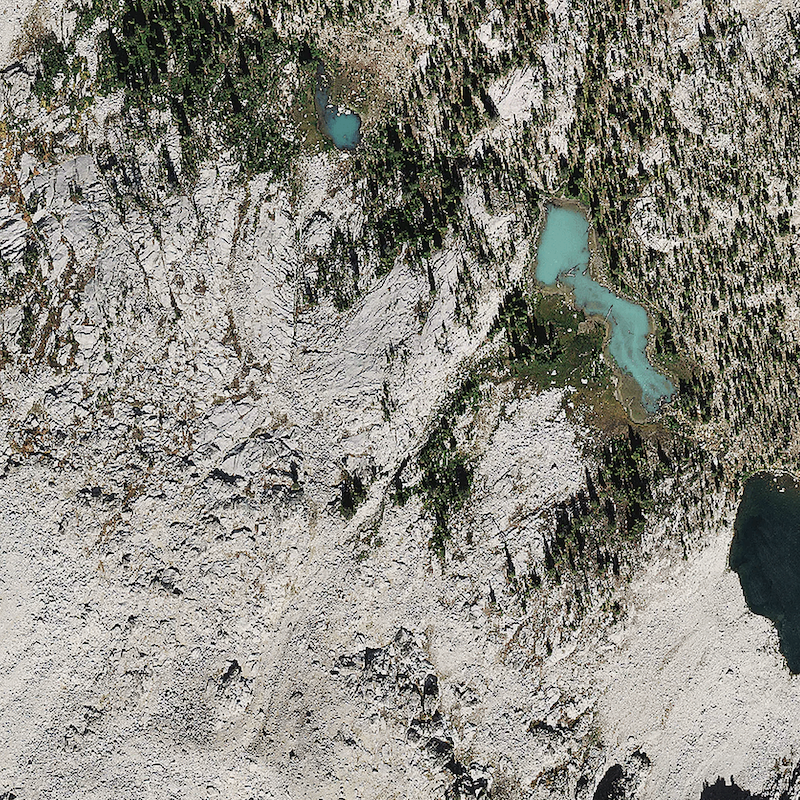
Imagery
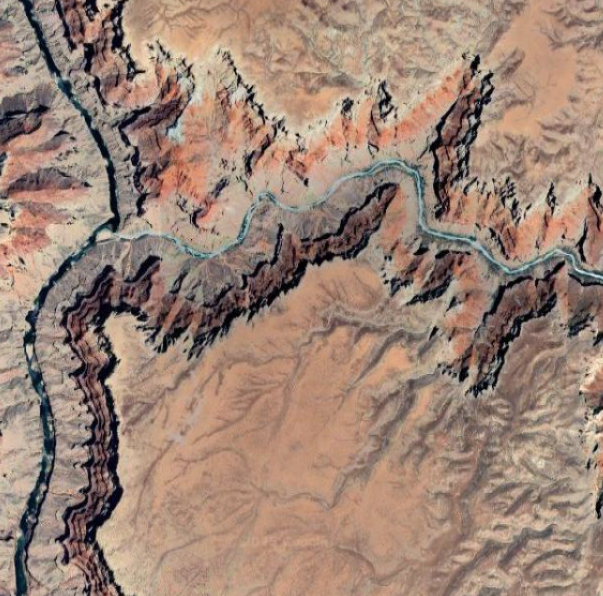
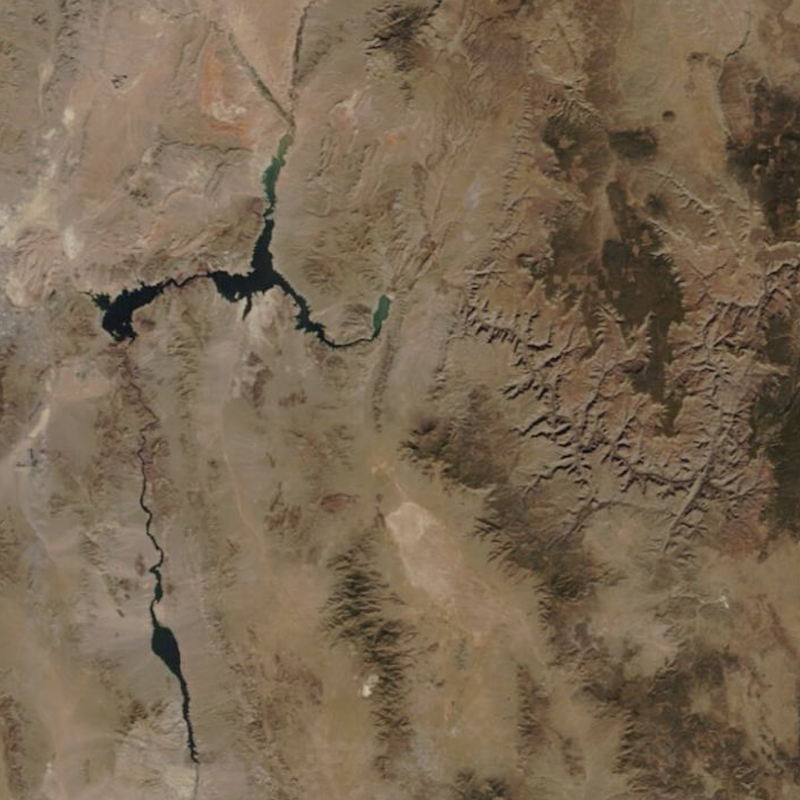
The Global Imagery layer contains aerial and satellite imagery from most of the land masses of the world. Lower zoom levels draw from sentinel satellite imagery and higher zoom levels incorporate MapBox layers. This layer is updated every few years and resolution varies but can be as high as 50 cm in some areas. This is a fantastic layer for exploring different parts of the globe and we are excited to offer nearly worldwide coverage.
Global Imagery in the lower 48 U.S. states incorporates high-resolution NAIP (National Agriculture Imagery Program) data at higher zoom levels.
High-resolution imagery is now also available beyond the lower 48, including in Canada, Alaska, Hawaii, Europe, Japan, New Zealand, Baja California, and parts of the Caribbean. In these regions, Vantor imagery provides enhanced detail at higher zoom levels for both online and offline use, as well as in printed maps.
In areas outside these supported regions, Global Imagery will fall back to lower-resolution Sentinel imagery at higher zoom levels, particularly for offline use and printing due to licensing limitations.
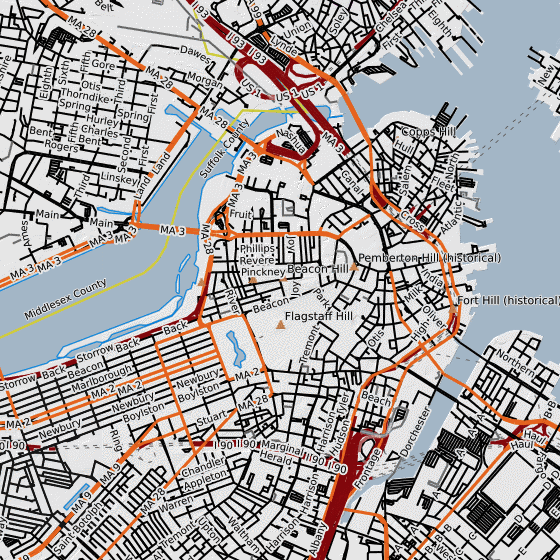
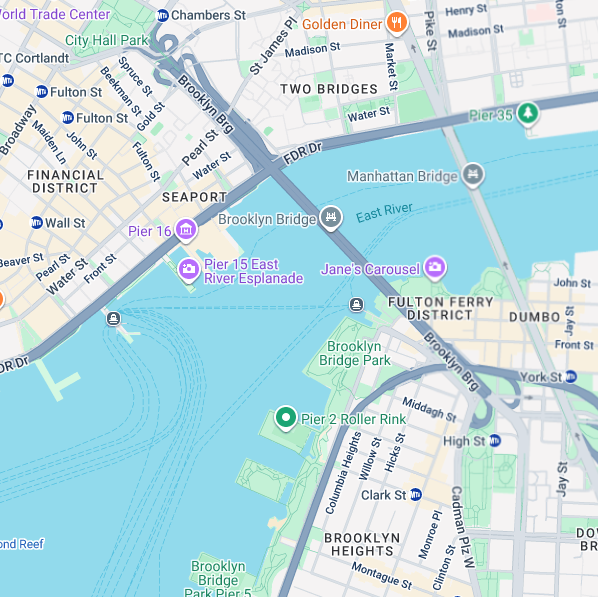
MapBuilder Roads
This layer highlights highways, roads and paths, along with subtle shaded relief, major boundaries and some geographical features such as peaks and bodies of water for reference. It is a good choice in urban areas or when you want to focus on roadways with minimal background noise.
Additional Maps
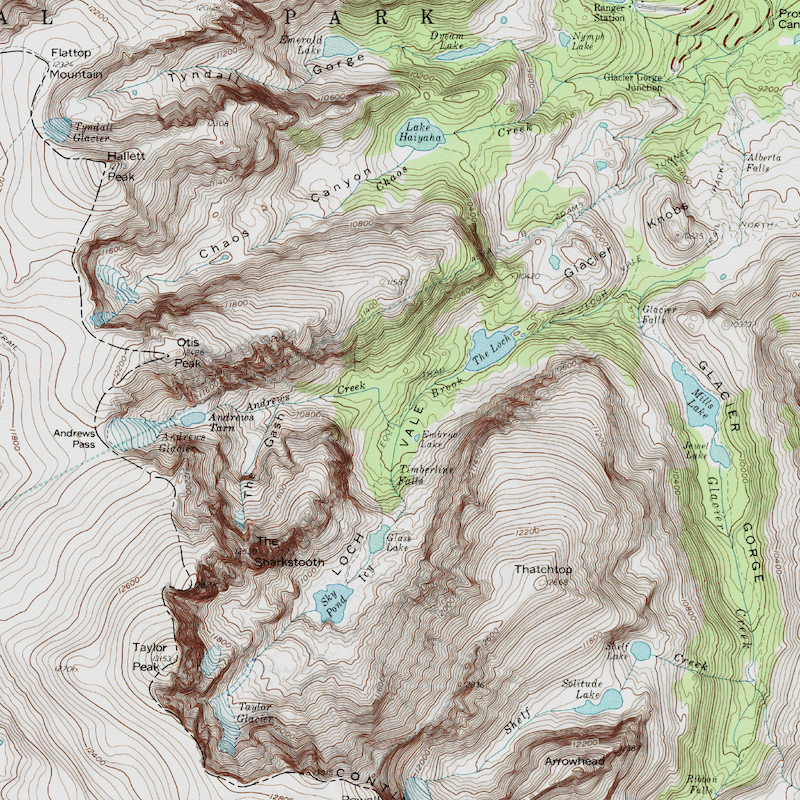
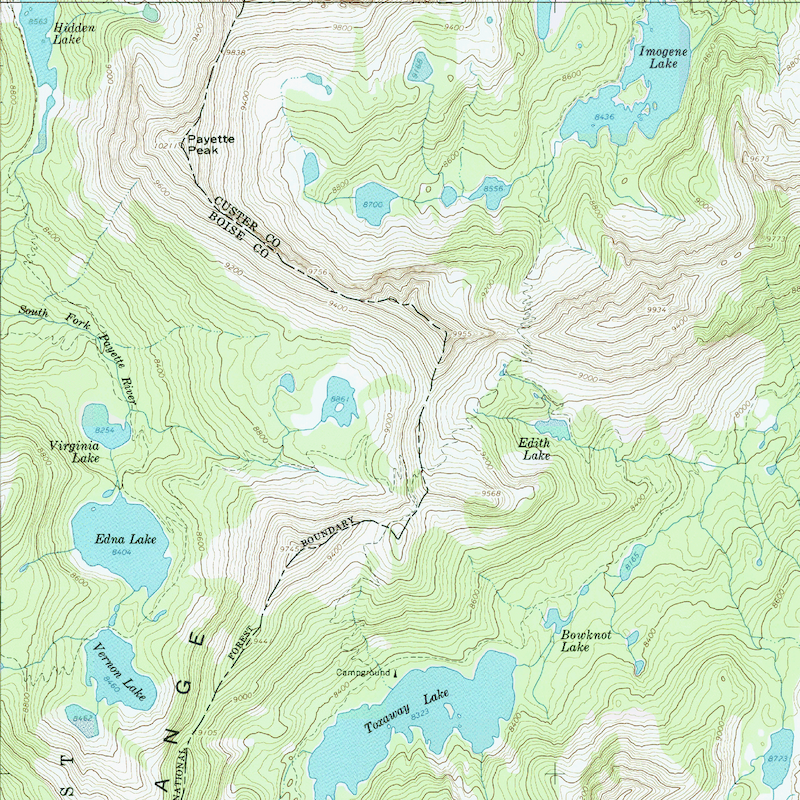
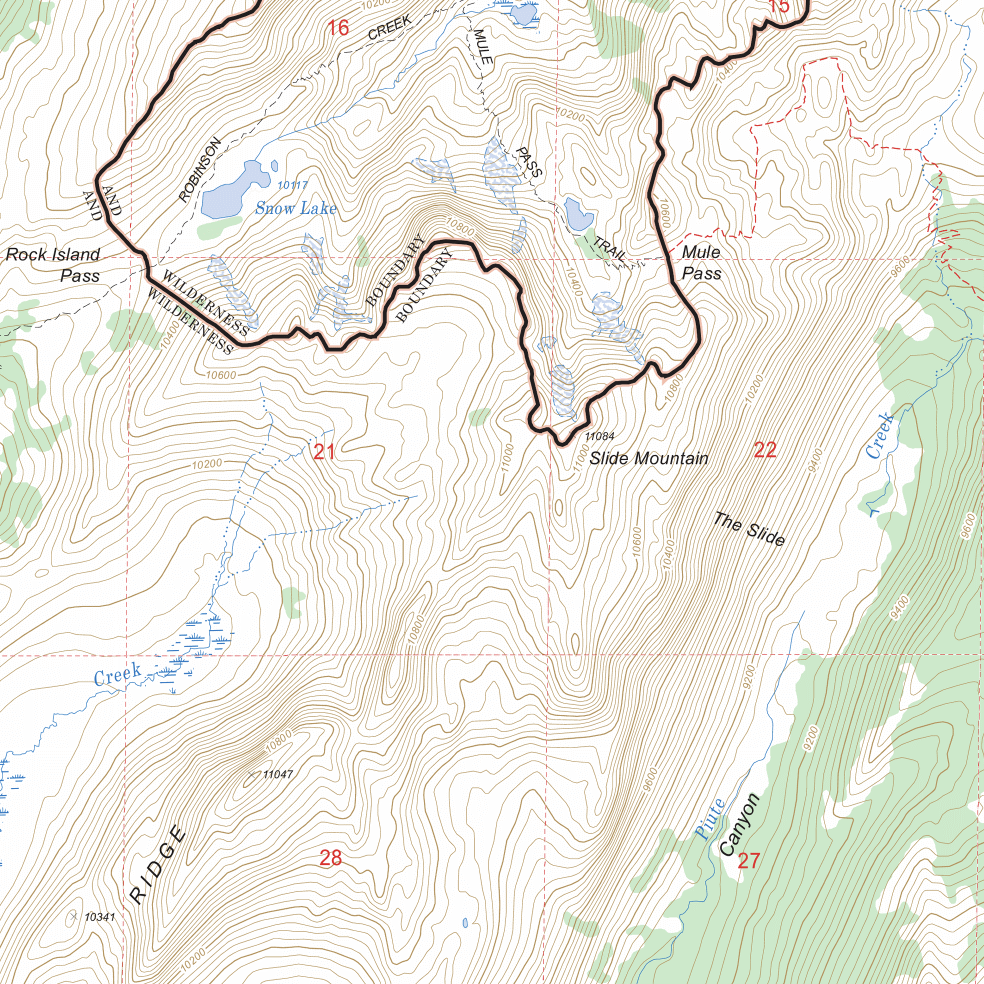
Scanned Topos
The Scanned Topos base layer displays maps that are probably very familiar to most outdoor recreationalists. This base layer contains 7.5’ quads assembled from scanned PDFs from a variety of data sources including USGS, NRCAN, INEGI and LINZ.
These maps provide excellent detail at close zoom levels and can be the best choice in remote or less traveled areas. However be aware that these maps can vary widely in age depending on the location of the map. It is possible that there may be more recent quad maps that have not been integrated into this layer. In addition, it is difficult to see trails or read text when zoomed out, which makes these layers difficult for high level trip planning.
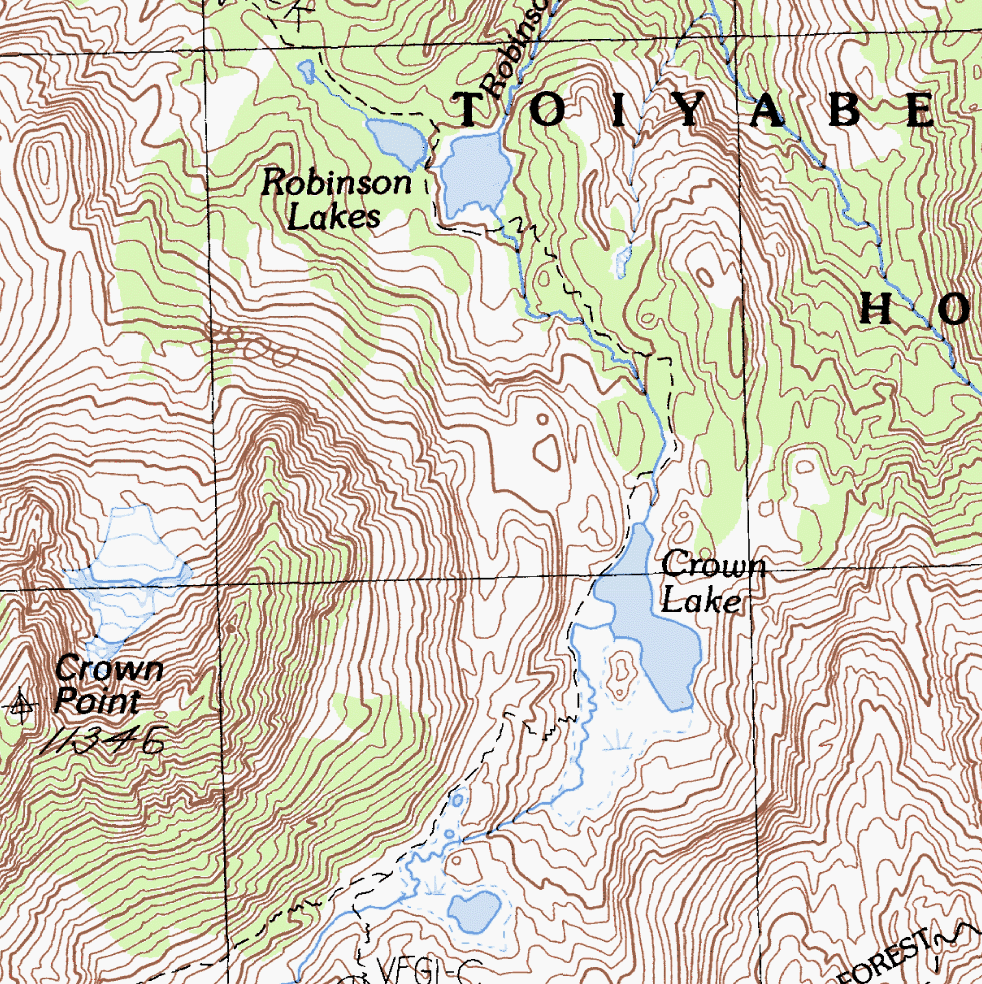
Forest Service
These are United States Forest Service (USFS) maps assembled from FSTopo PDFs. These maps are only available for land areas managed by the USFS. They contain trails, roads, campsite and other information, but often lack continuity with surrounding land ownership types. For example, Yosemite National Park will show up as a blank white space since it is managed by the National Park Service and not the USFS. As a solution you could layer USFS maps over MapBuilder Topo or another base layer to fill in the holes.
You can choose to display maps from 2016 with or without vegetation forest shading (white and green, respectively) and from 2013 using the drop down menu that appears.
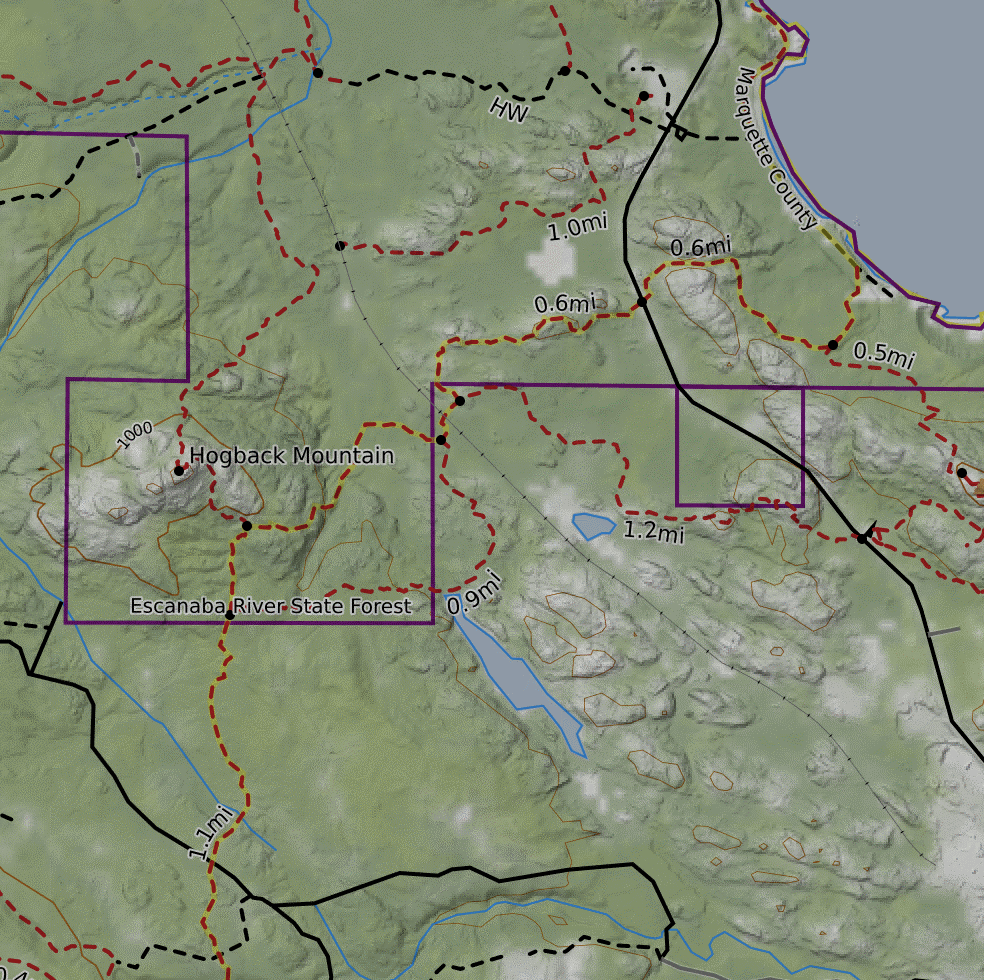
TF Outdoors
TF Outdoors comes to CalTopo from Thunderforest. Thunderforest Outdoor maps are aimed at all types of outdoor enthusiasts with a focus on displaying hiking routes, ski runs and other useful points of interest. These community sourced maps also draw data from OpenStreetMap contributors.
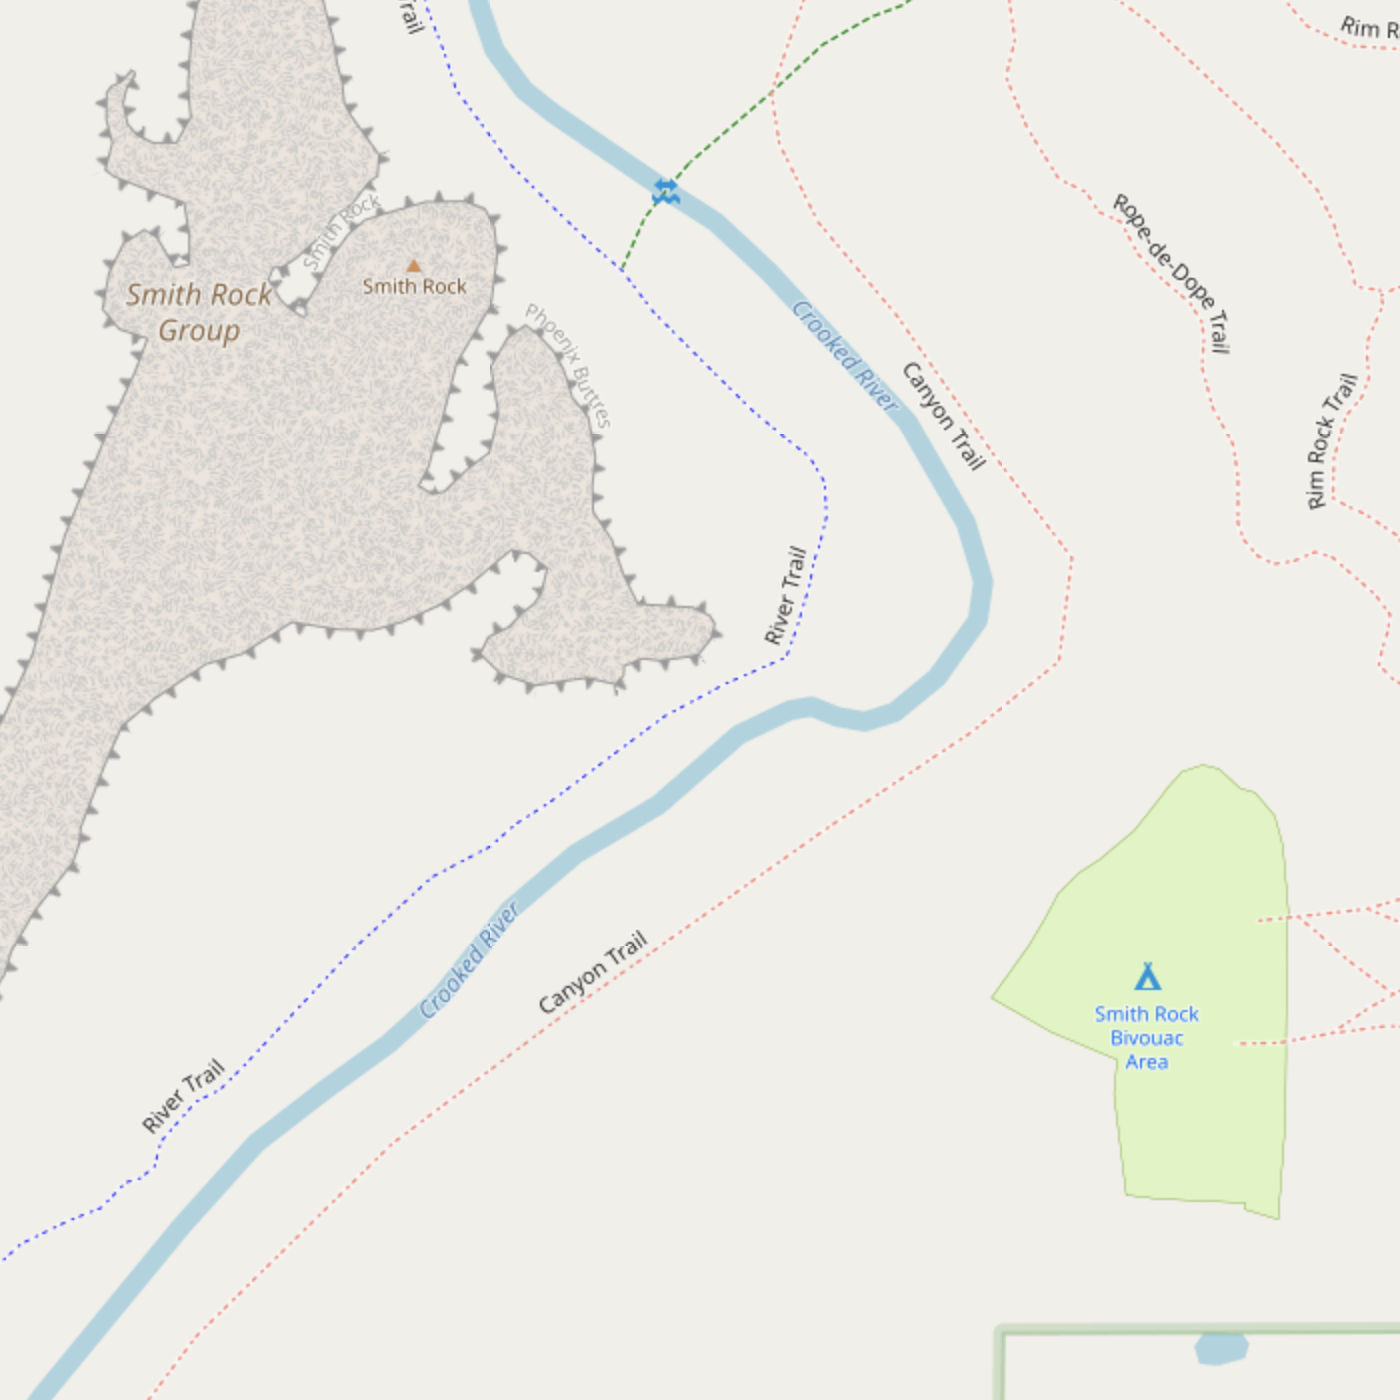
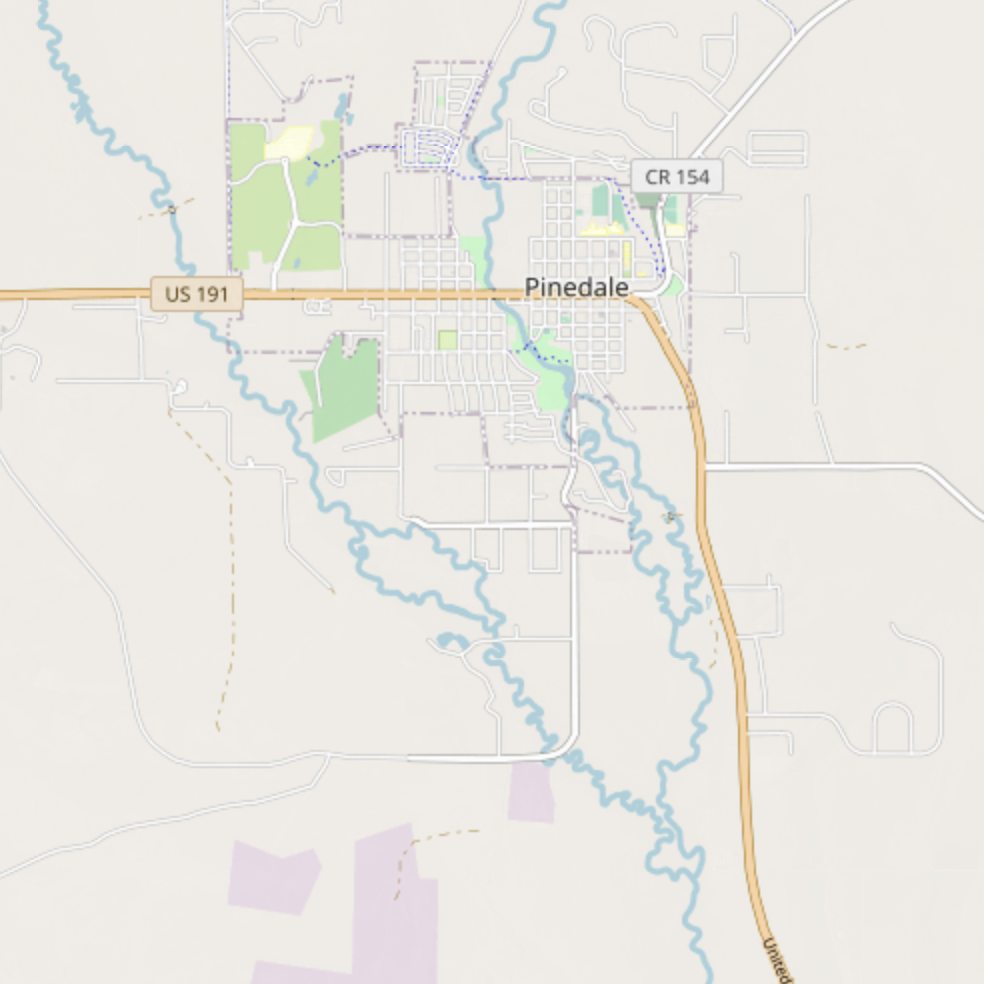
OpenStreetMap
OpenStreetMap is a product of a community sourced mapping project operated by the OpenStreetMap Foundation. Contributors from all over the world provide and maintain local data about roads, trails, buildings and much more. Since this layer draws from a dynamic data source, it is updated on CalTopo quarterly. If you notice something is missing or inaccurate, you can edit the map itself at OSM following their guidelines. You would see any edits in this layer, as well as any CalTopo layer that draws data from OSM, within 3-4 months typically.
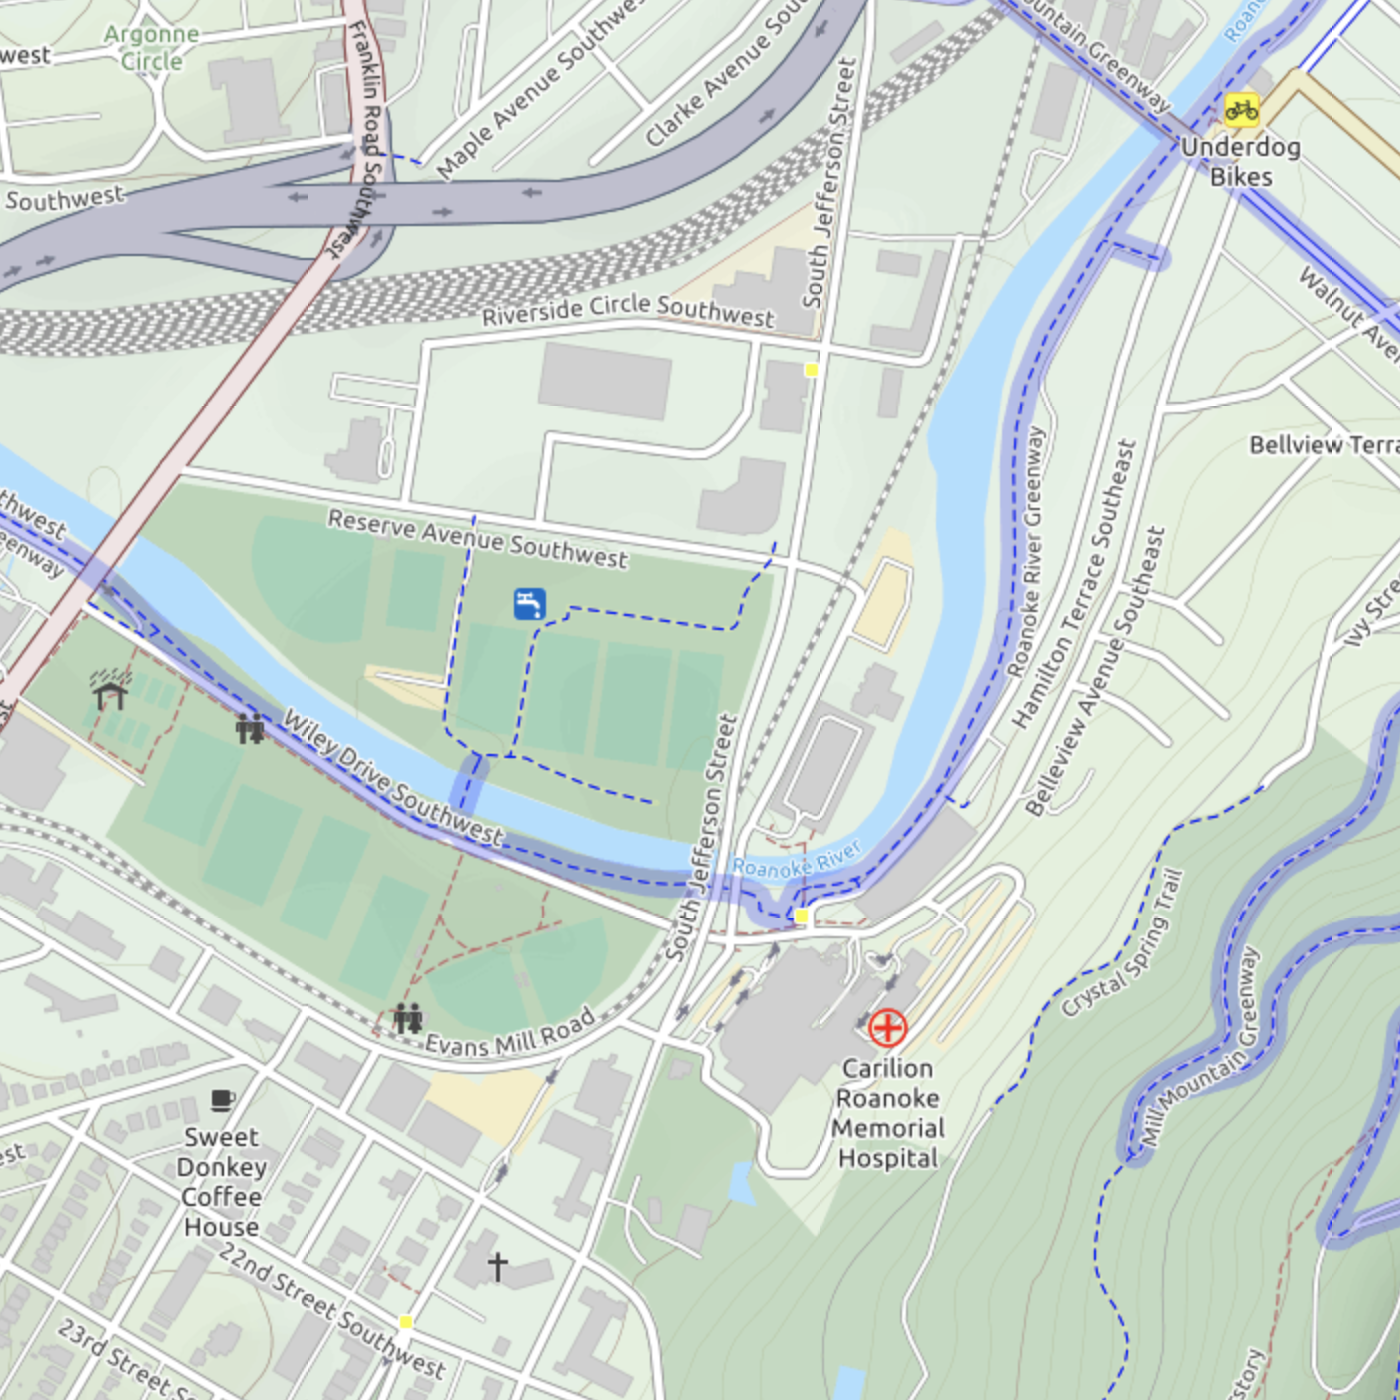
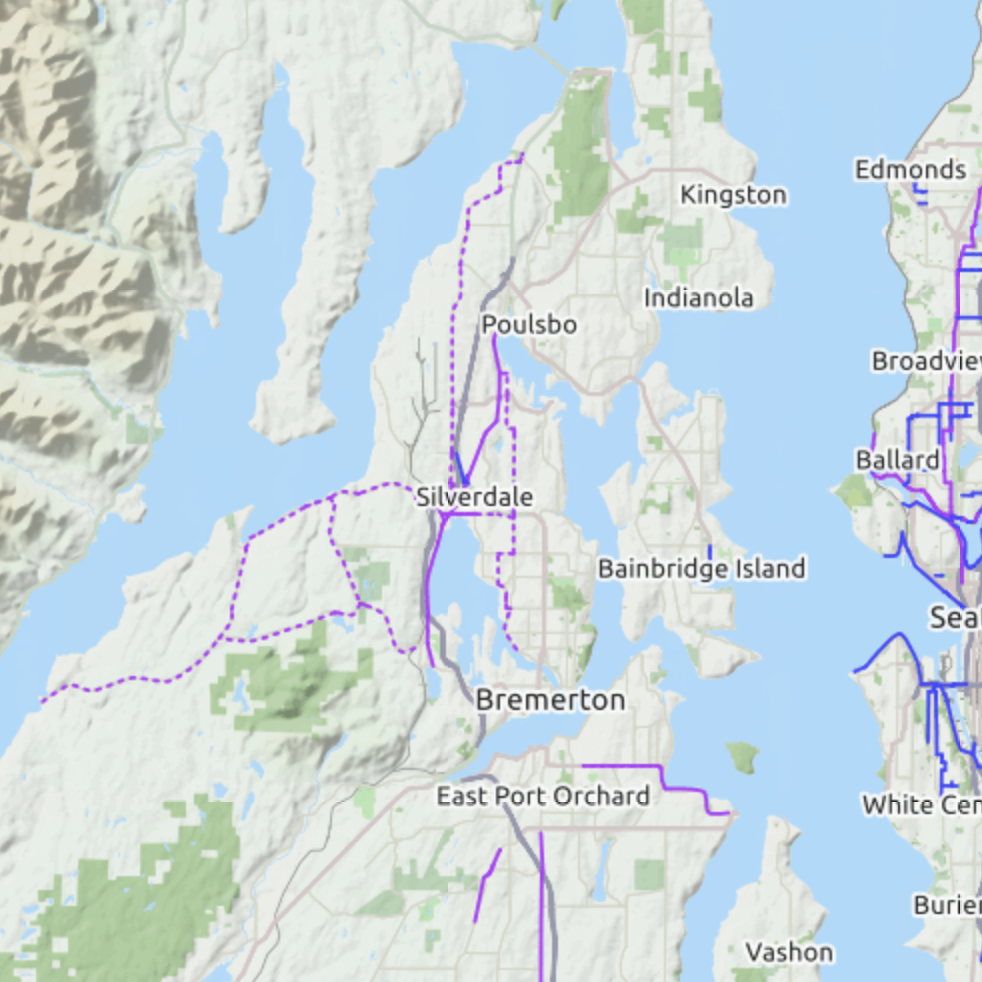
OpenCycleMap
OpenCycleMap comes to CalTopo from ThunderForest and OpenStreetMap contributors. This community sourced map is focused on presenting information useful to cyclists, such as bike routes, bike racks and restaurants. It also incorporates subtle topographic and terrain shading.
Additional Imagery
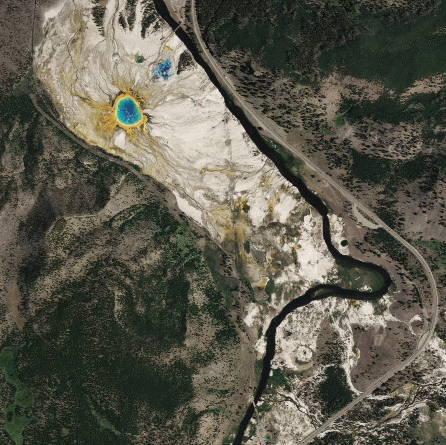
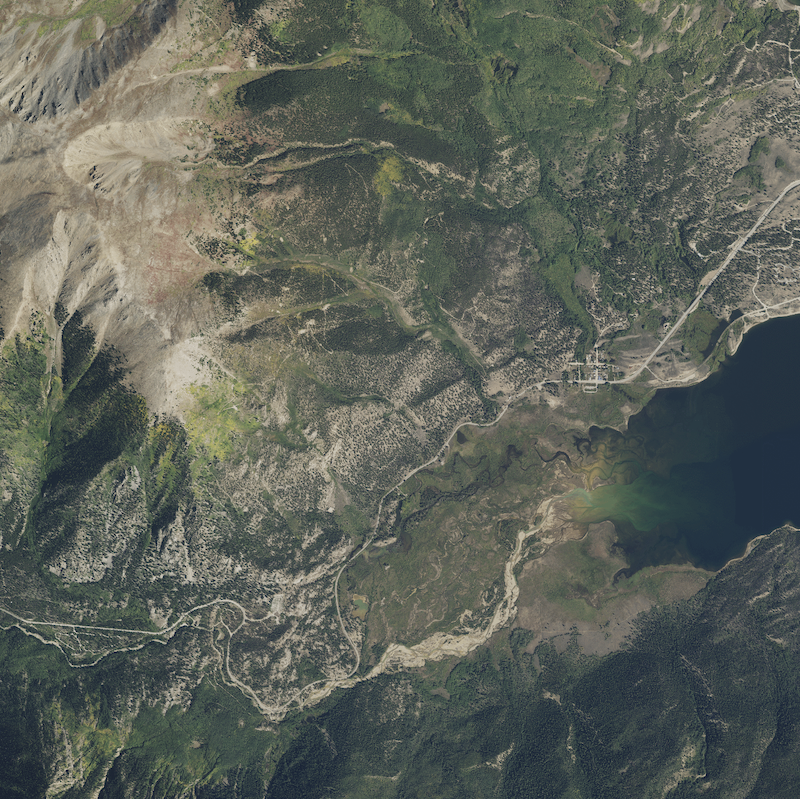
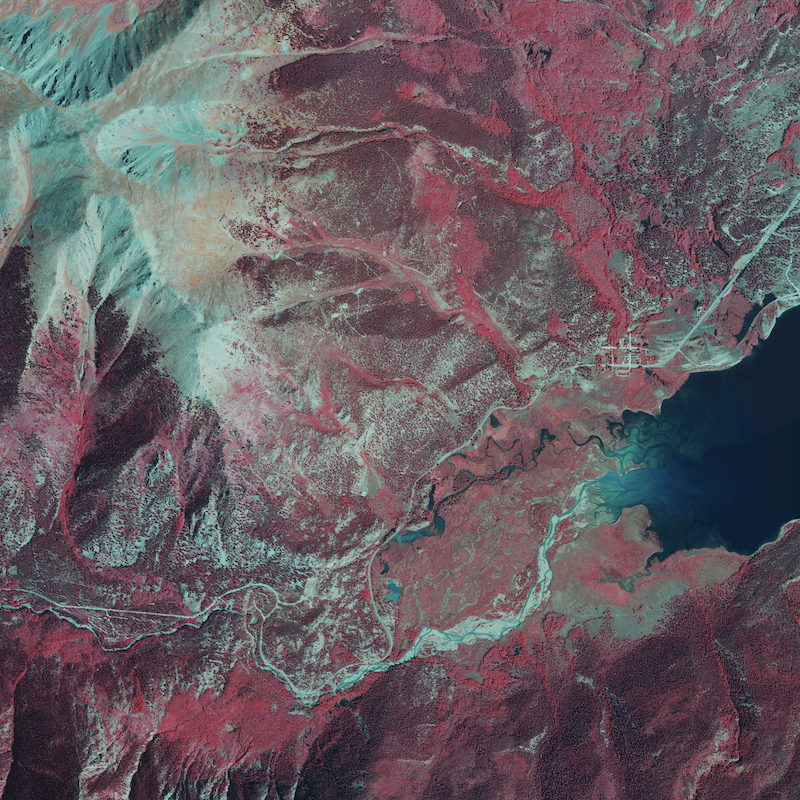
NAIP
NAIP displays aerial imagery from the National Agriculture Inventory Program. Only available in the continental United States, this high detail imagery has a horizontal resolution of 1 m. Since the original purpose of the project was to support agriculture, all images were taken in the summer, and thus should not be limited by significant snow cover that would hide features or land types. This layer is a great choice if you want to print aerial imagery in the CONUS.
You can choose from two sets of years or False Color IR in the drop down menu that appears. Multiple sets of years are available to give you options for when the lighting may have been better for viewing in a particular area. False Color IR is especially useful for highlighting vegetation, which is displayed as red.
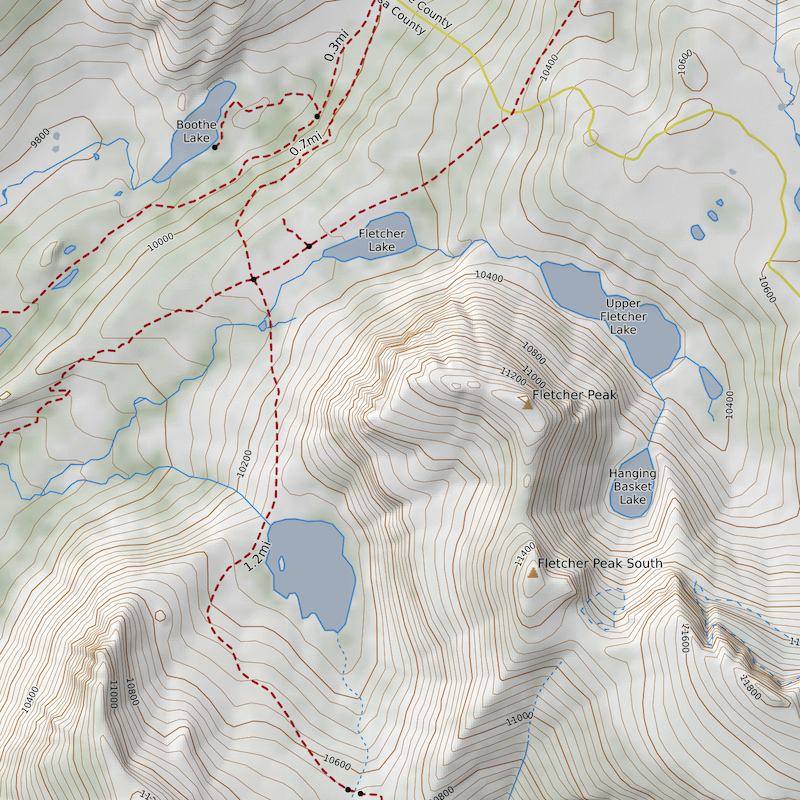
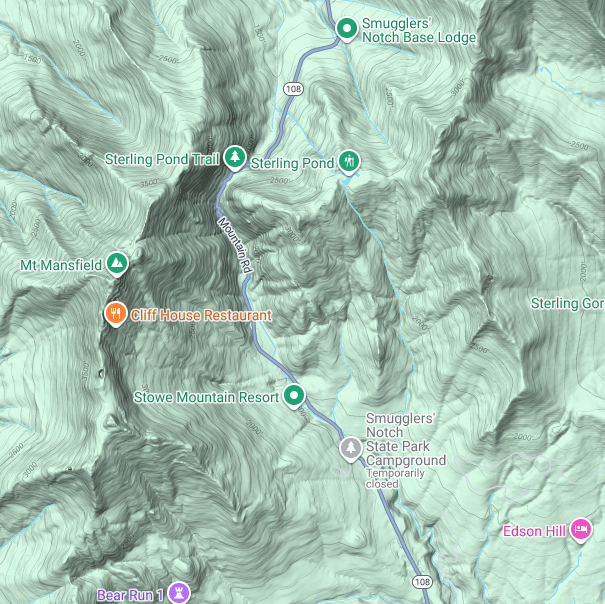
Google Terrain
Google Layers are included with Pro and higher subscriptions, but are only available on the web.
Terrain-focused map that includes shaded relief and contour lines to emphasize landscape features. Includes roads, boundaries, and place names for context. Not available for printing.
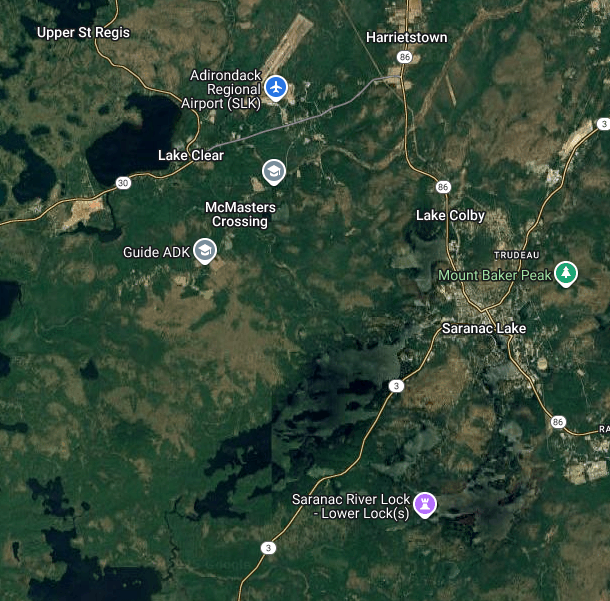
Google Hybrird
Google Layers are included with Pro and higher subscriptions, but are only available on the web.
Combines Google Satellite with an overlay of roads, city, and place names. Provides high resolution imagery alongside key map details, such as street names and landmarks. Not available for printing.
Google Sattelite
Google Layers are included with Pro and higher subscriptions, but are only available on the web.
Satellite imagery with resolution up to 20-30 cm in urban areas and 1.5-m elsewhere. Provides a detailed view of buildings, roads, and natural landscapes. Not available for printing.
Google Map
Google Layers are included with Pro and higher subscriptions, but are only available on the web.
Classic street map from Google displaying roads, place names, and points of interest. Designed for general navigation along roads and in towns.
Specialty
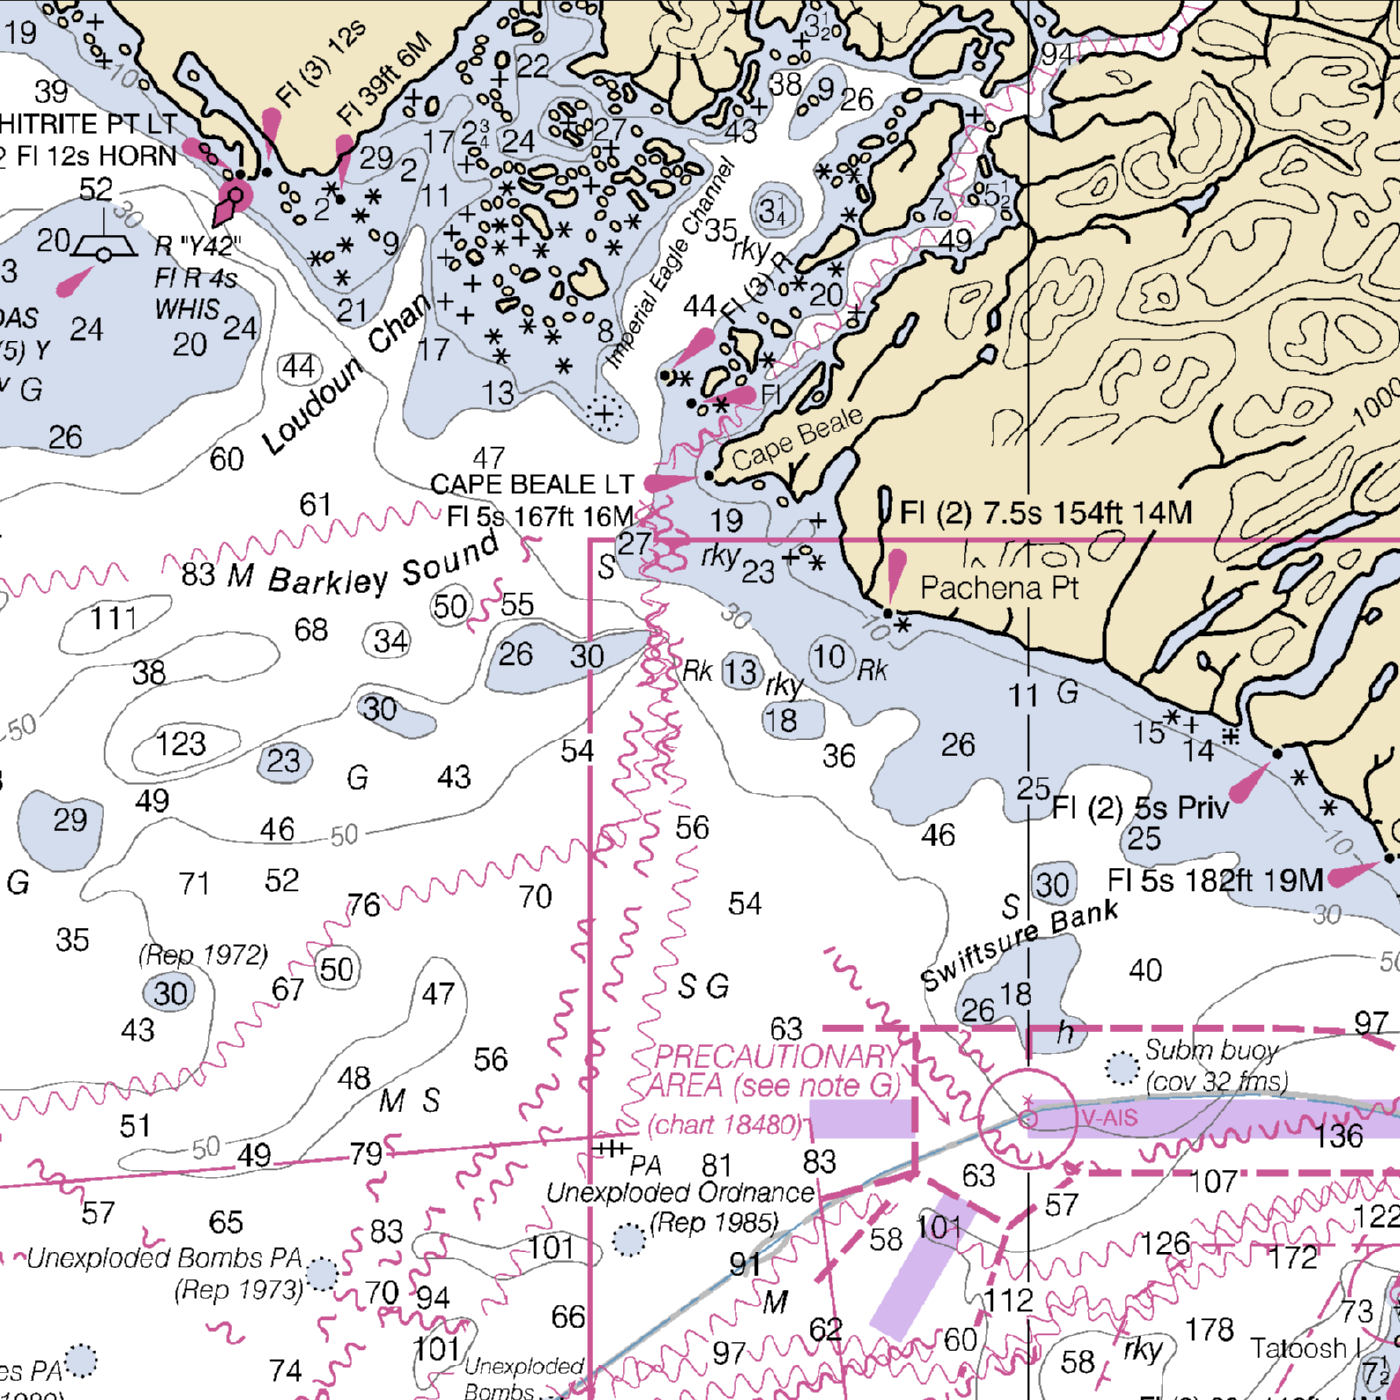
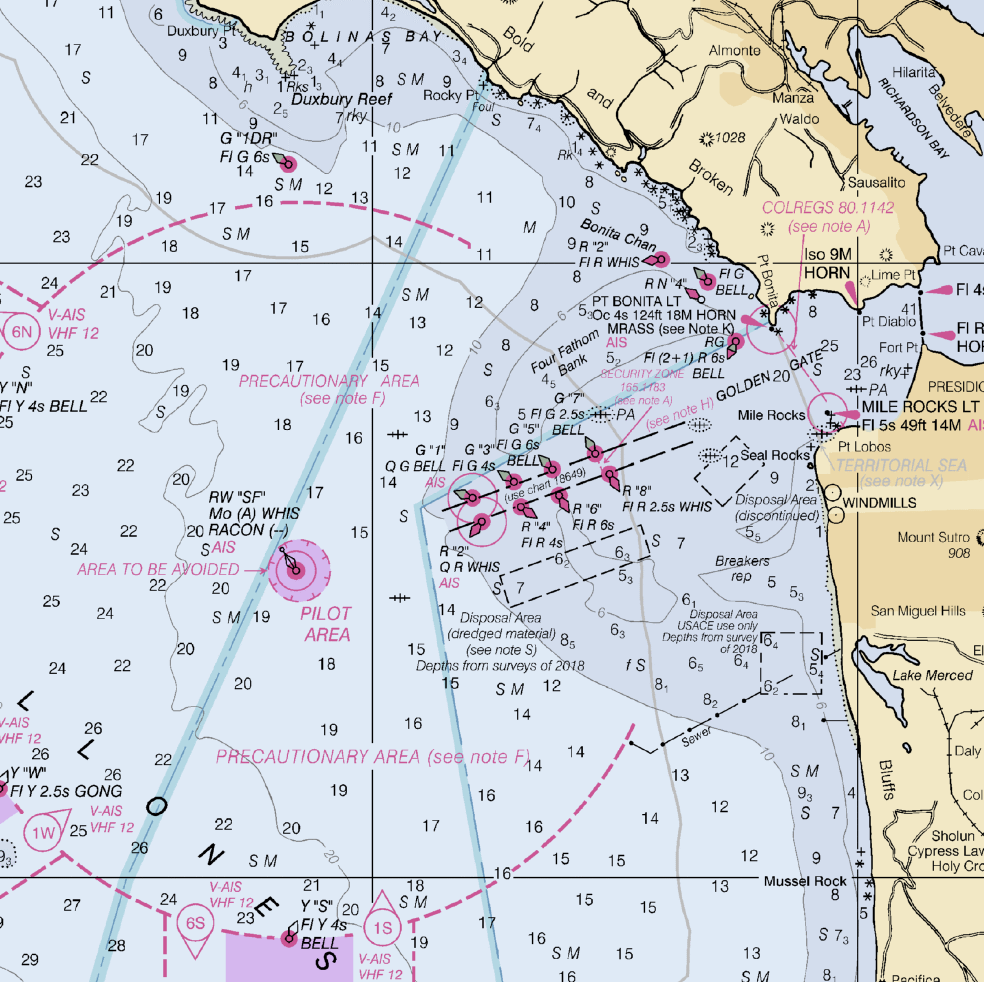
Marine Charts
These are standardized nautical charts from the National Oceanic and Atmospheric Administration (NOAA). These charts have been quilted together to provide a seamless view. They provide coverage for shoreline and waters within and immediately adjacent to the United States Exclusive Economic Zone.
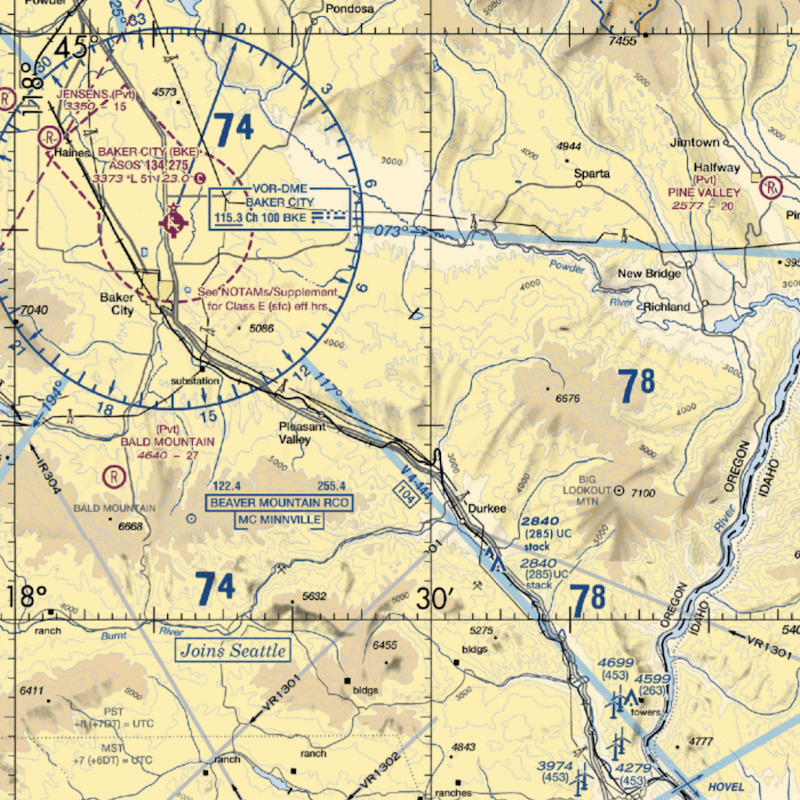
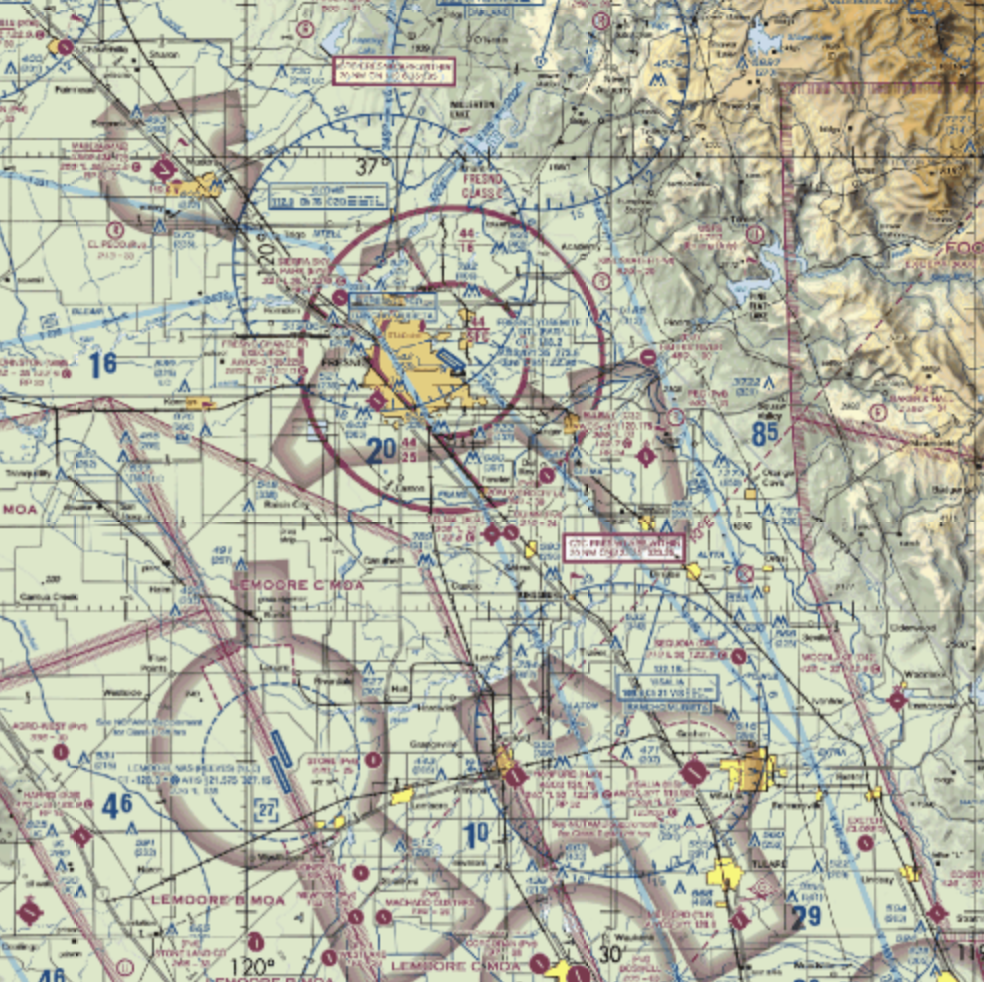
FAA Sectional Charts
These charts present 1:500,000 scale sectional aeronautical charts from the United States Federal Aviation Administration (FAA). These charts provide visual checkpoints, such as populated areas, roads and other distinctive landmarks, for flying slow to medium speed aircraft under visual flight rules. They also include visual and radio aids to air paths, airports, navigation and other related data.
These maps cover the United States and its territories.
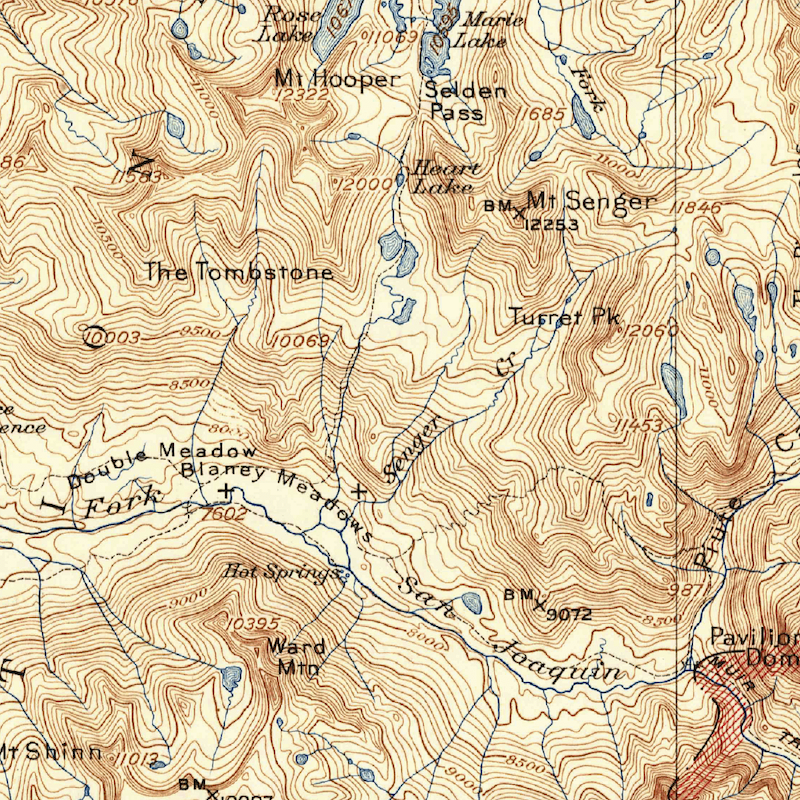
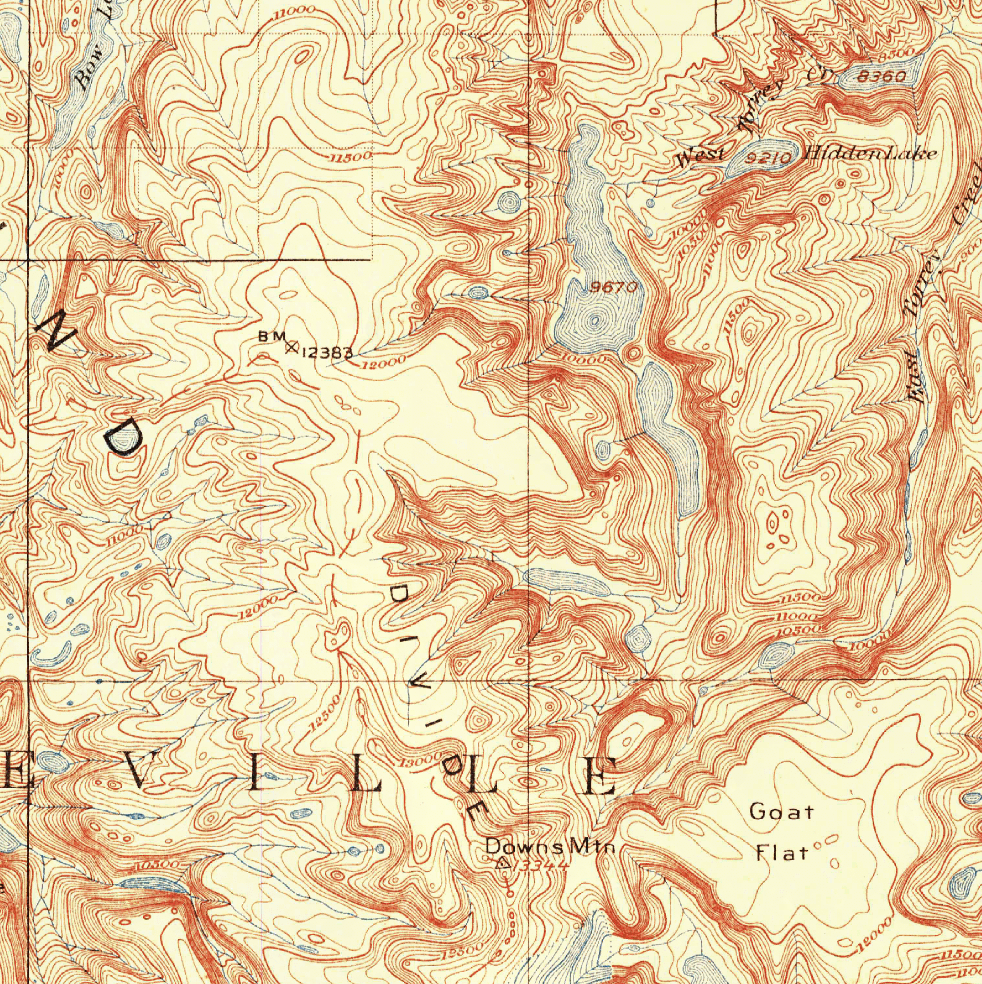
Historic Maps
With these, you can view scanned historical topographic maps from 1885-1915 and 1915-1945 (although the 1915-1945 set may contain survey data from prior to 1915). These historic maps can be a neat history lesson, or provide information about routes that are passable but no longer maintained, such as old miner trails. They are generally fun for exploring or useful for research, but not so helpful for navigation or learning about current conditions.
Also while the scan quality is impressive, the colors and darkness can vary heavily from scan to scan and coverage may not be available in all areas.
Live Satellites
Sentinel Weekly
Live Satellite Layers are limited to Pro Subscriptions and higher.
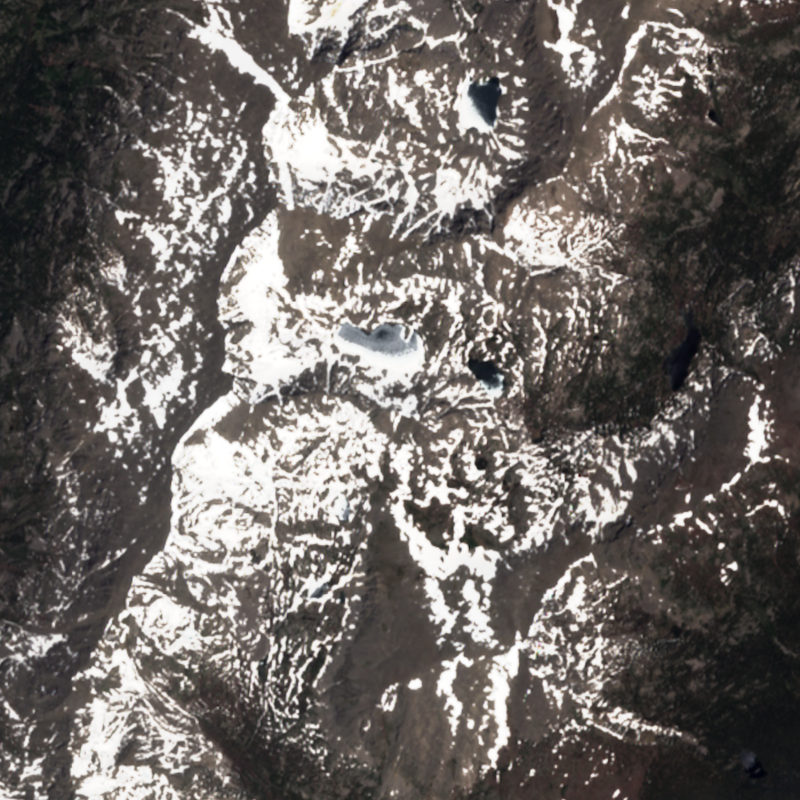
Imagery from the Sentinel-2 satellite covers the entire earth from the same viewing angle every 5 days with a 10-m horizontal resolution. The date that the image was taken is displayed on the raw image, although you may have to zoom out a bit or pan around to find it. We license this layer and don’t know precisely when the next image in your area will be taken, but it is typically within 5 days. This is a great layer for checking out current conditions, such as snow coverage in the mountains. However the true color imagery can be affected by cloud cover.
You can change the type of image displayed using the dropdown menu that appears. By default, Sentinel images are displayed as True Color (the way they normally appear to the human eye). You can also choose to display the same image as False Color Red, False Color Green or False Color Burn. False color visualizations incorporate at least one non visible wavelength and can highlight unique aspects of the land that would otherwise be obscured as well as cut through atmospheric clouds and smoke.
You can also “go back in time” using the other dropdown menu that appears. You can look at imagery from a week ago or go back several years at set intervals.
MODIS Daily
Live Satellite Layers are limited to Pro Subscriptions and higher.
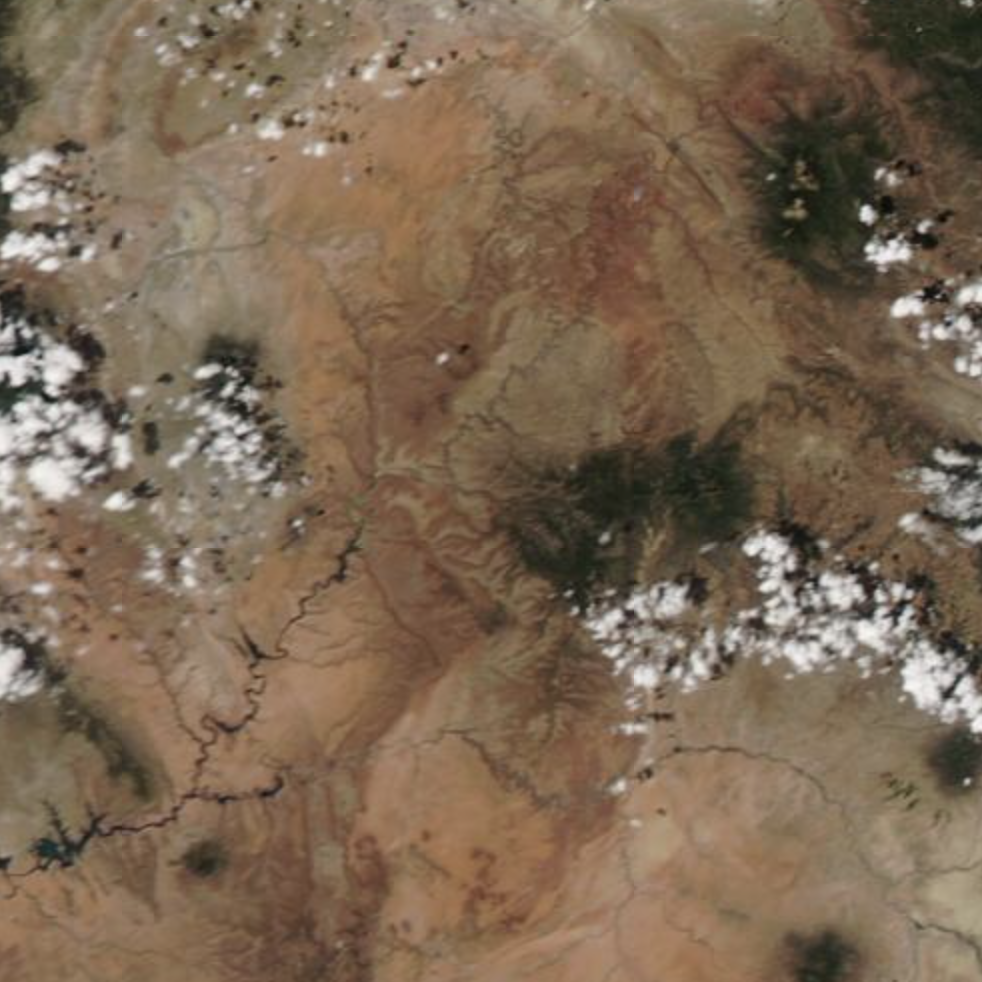
This layer allows you to view daily satellite imagery from MODIS and VIIRS satellites. The resolution depends on the satellite selected and varies from 250-375 m. This layer is best viewed at a higher zoom level and can be useful for checking out current conditions on a larger scale. By default the latest imagery from any satellite is displayed. Cloud cover can affect the ability to view this layer.
You can choose which satellite you want to display imagery from using the dropdown menu that appears. The Aqua (2002) and Terra (1999) satellites pass around the Earth once every 24 hours, each carrying MODIS instruments and recording visual imagery of the earth with a 250m resolution. The Suomi NPP (2011) and NOAA-20 (2017) satellites make multiple passes around the Earth every 24 hours, each carrying VIIRS instruments aboard and recording imagery with a slightly less detailed resolution range of 375 m. Nightly imagery is also available from the Suomi NP satellite.
You can also “go back in time” and look at archived imagery from specific dates using the other dropdown menu that appears.
GOES Live
Live Satellite Layers are limited to Pro Subscriptions and higher.
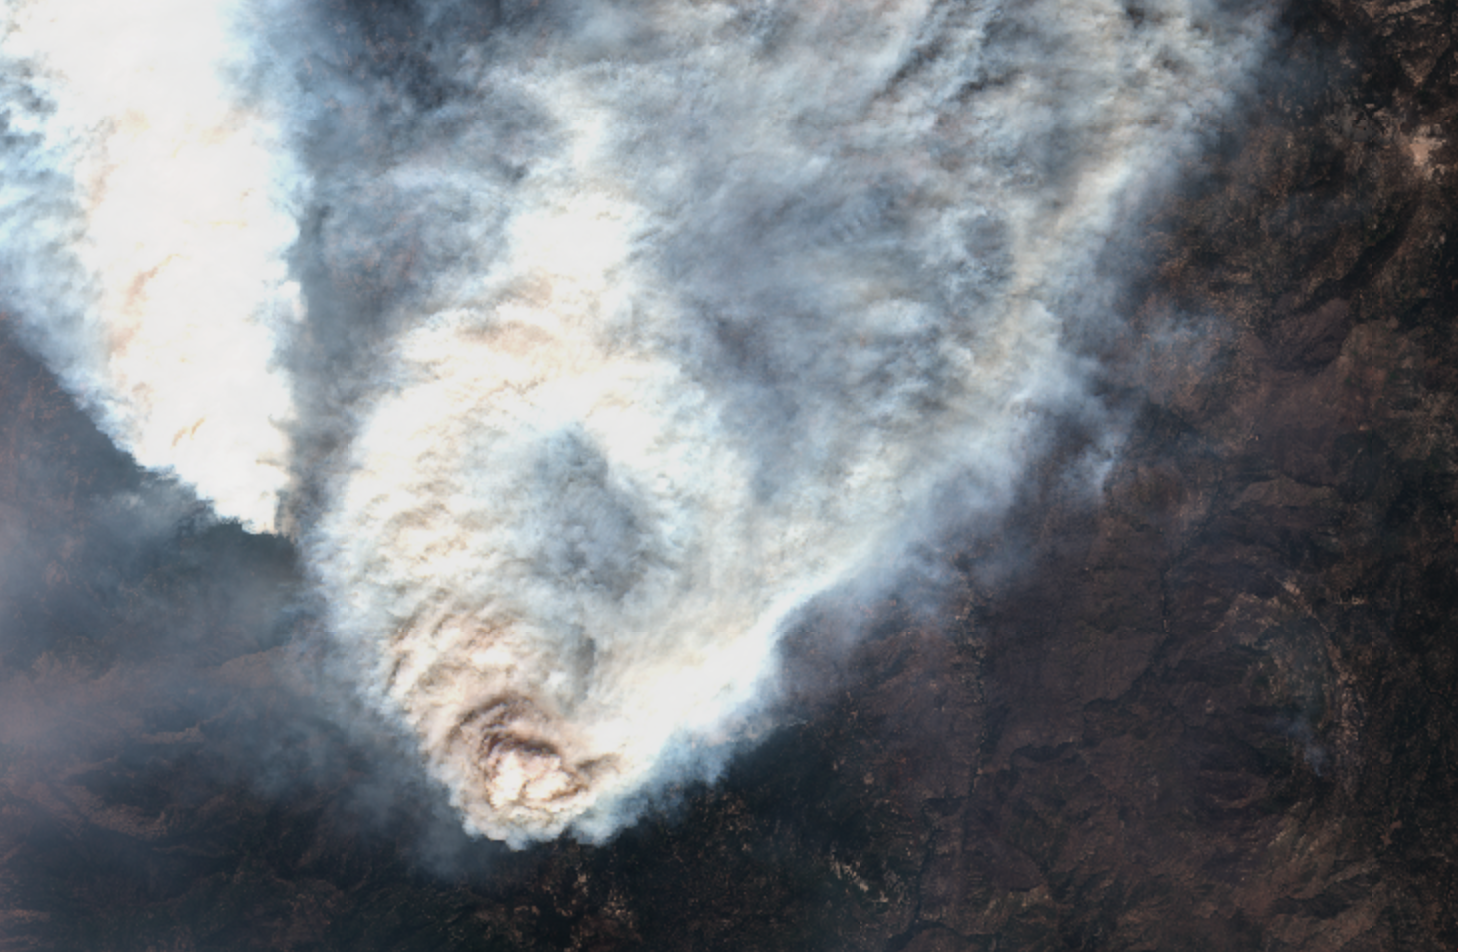
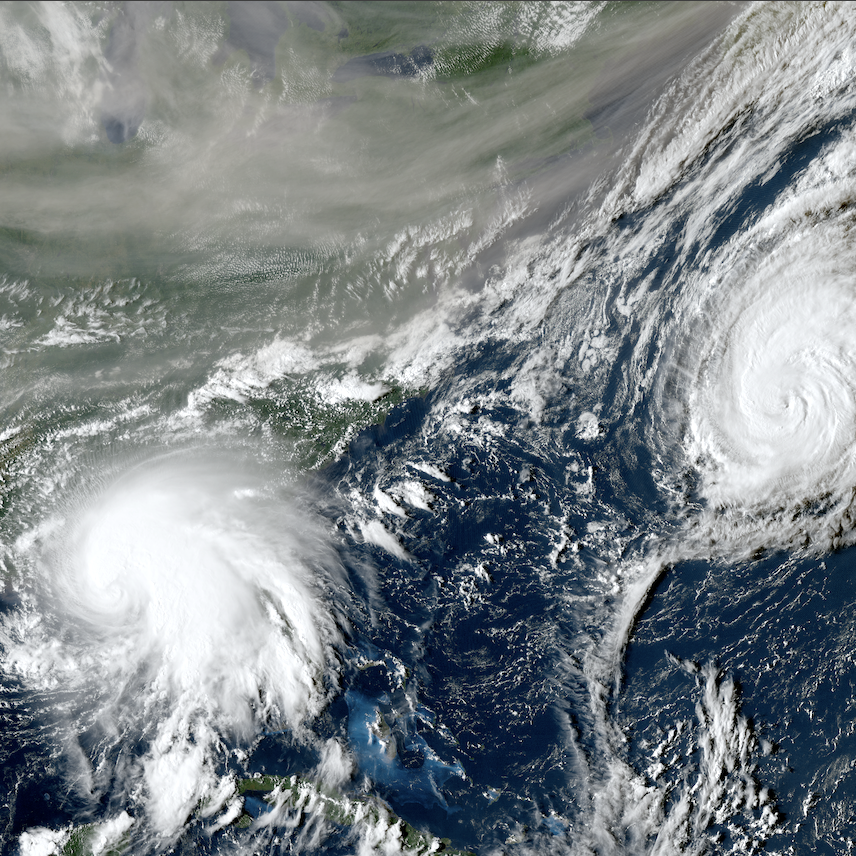
GOES Live is an experimental layer that presents near real-time satellite imagery from the geostationary GOES 16 and 17 satellites positioned over the eastern and western United States respectively. It offers a 1-km horizontal resolution and auto-refreshes every 5-8 minutes to ensure that you are viewing the most recent imagery. While a lower resolution than most of the other satellite layers, this layer provides real-time insights such as watching a hurricane or a fire progress on a large scale.
As with the other satellite and aerial imagery layers, you can “go back in time” using the dropdown menu that appears. You can look at imagery from earlier in the day on 30-minute intervals or view selected imagery from up to a week in the past.
GOES Live Temperature
Live Satellite Layers are limited to Pro Subscriptions and higher.
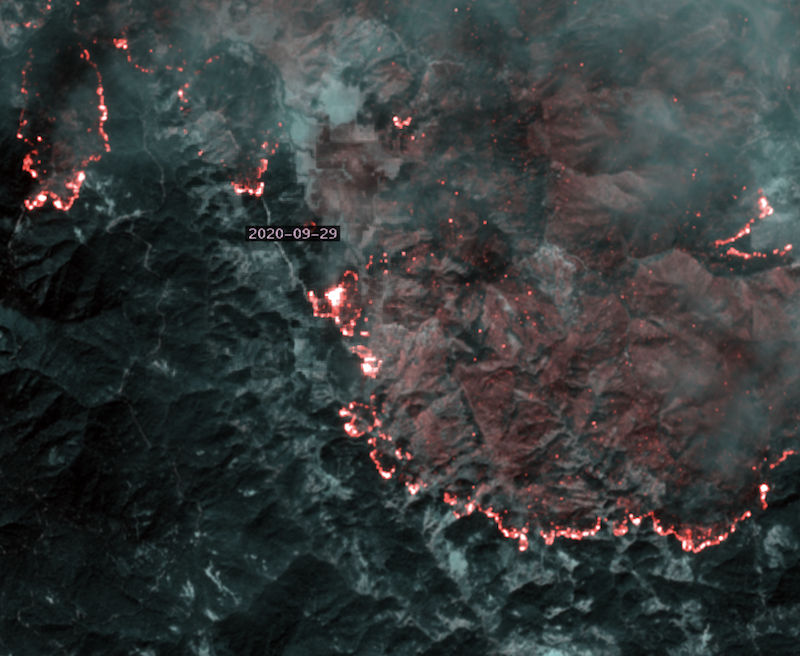
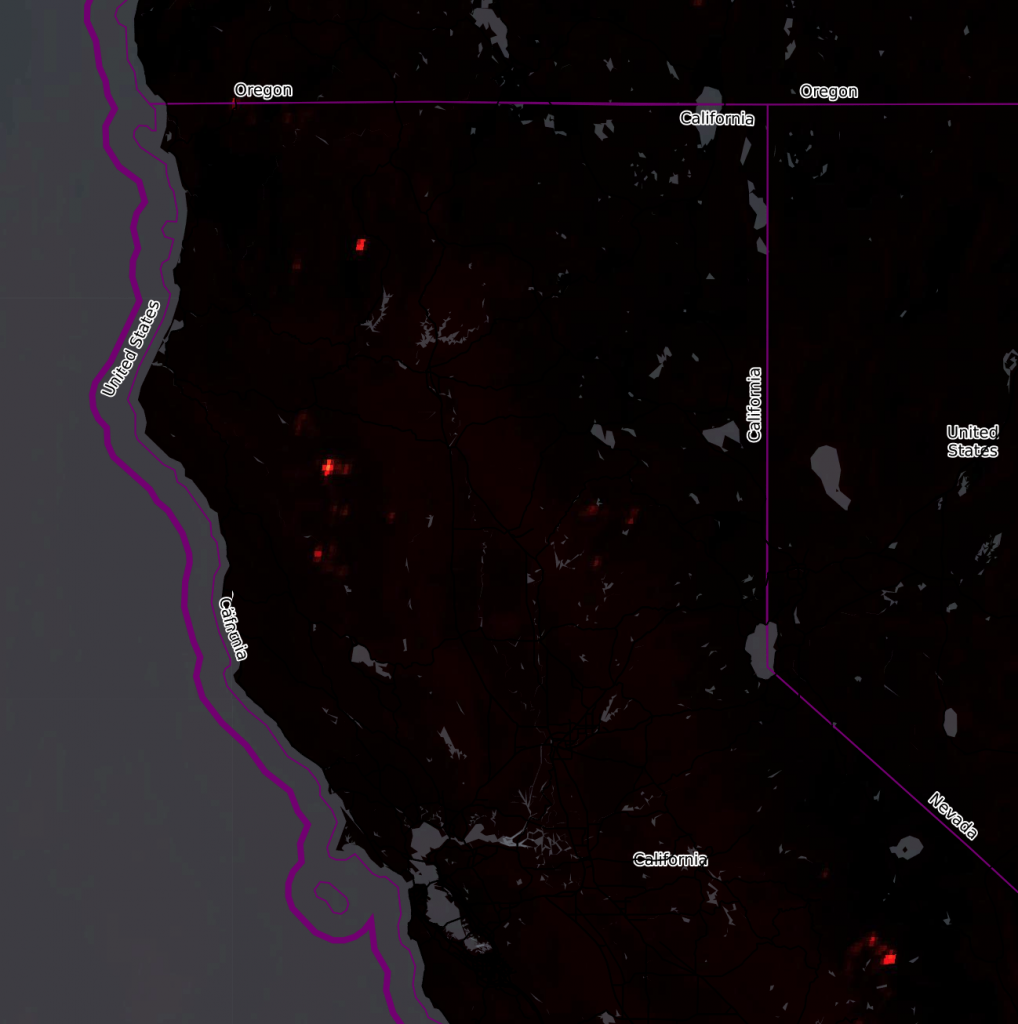
GOES Temperature is another experimental layer that provides false-color temperature visualization from the GOES 16 and 17 satellites. This layer allows you to identify hot spots and infer fire intensity. Just like the GOES Live layer, it auto-refreshes every 5-8 minutes to ensure you are viewing the most recent imagery.
You can also “go back in time” with this layer using the dropdown menu that appears.
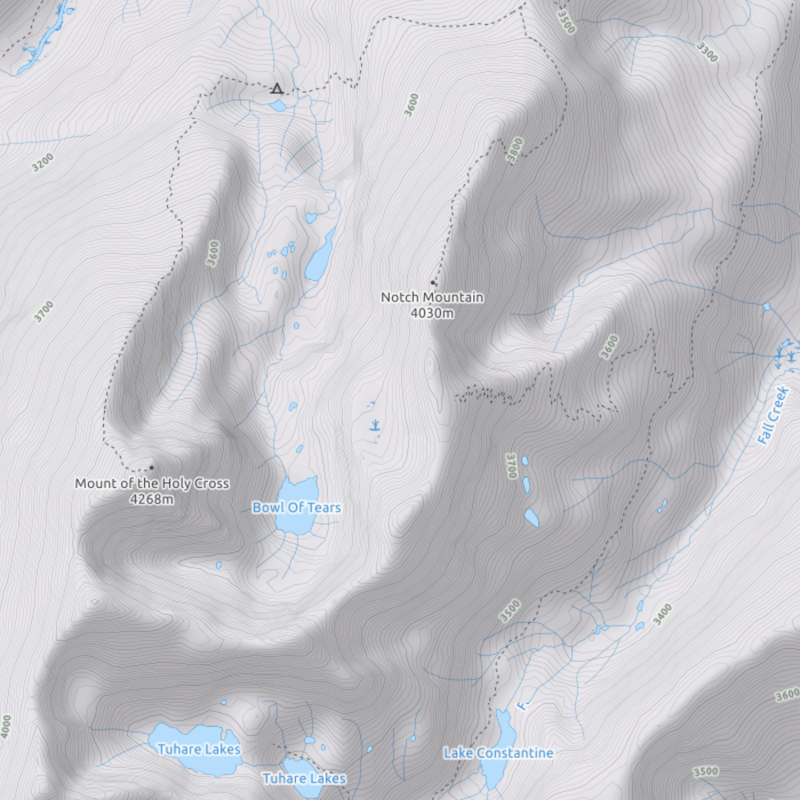
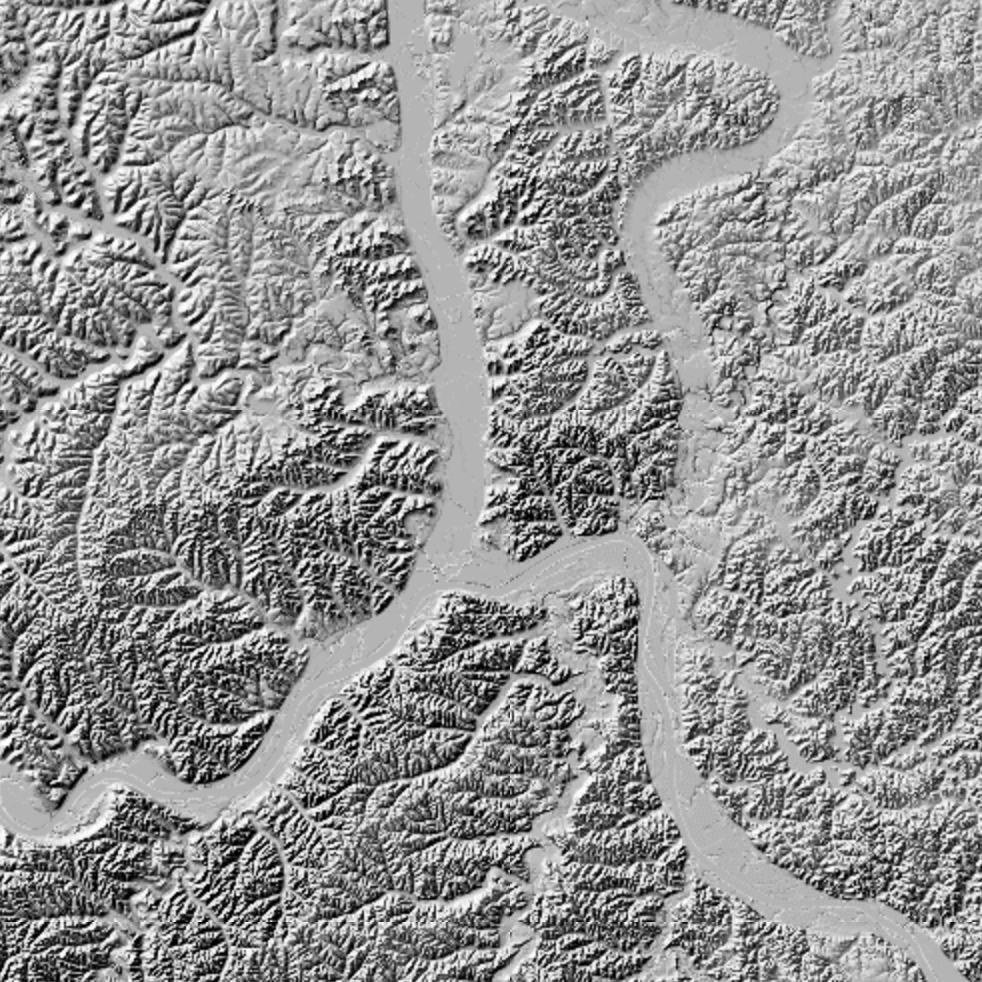
Shaded Relief
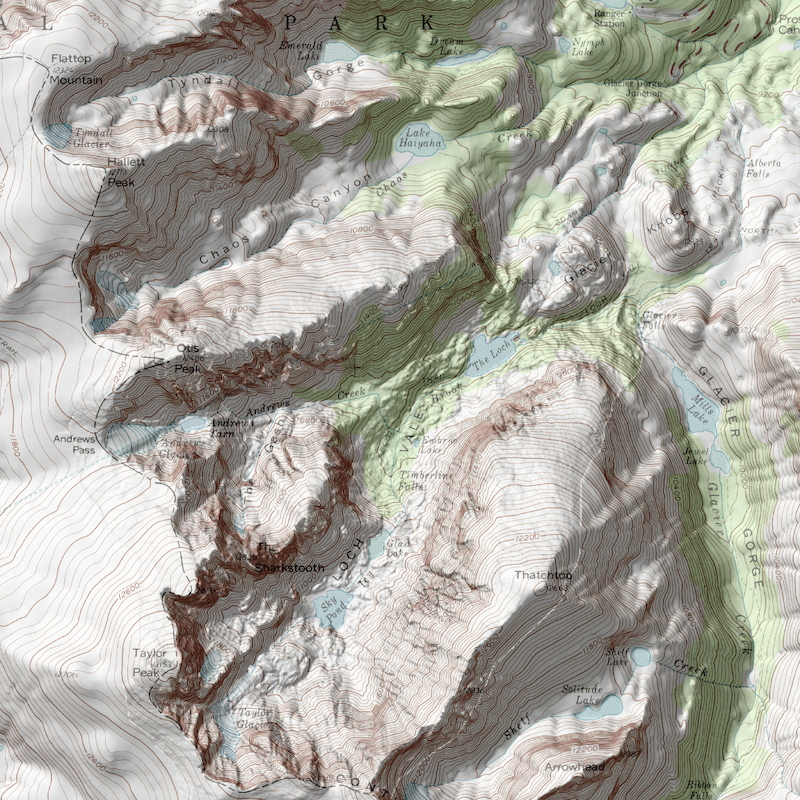
Normal Relief
Normal Shaded Relief allows you to better visualize elevation changes and highlight terrain features such as cliffs, ridges, valleys and gullies. This layer incorporates data from the USGS National Elevation Dataset and high-resolution LIDAR data from the USGS 3DEP program where available. Curious if the area you’re looking at is using the high-resolution data? A live interactive map of 3DEP coverage can be found here.
This layer is most often used in conjunction with other layers to add topographic shading. However, it can also be fun and useful for finding cool geomorphological artifacts such as old landslides or calderas, as well as distinguishing man made features in natural terrain.
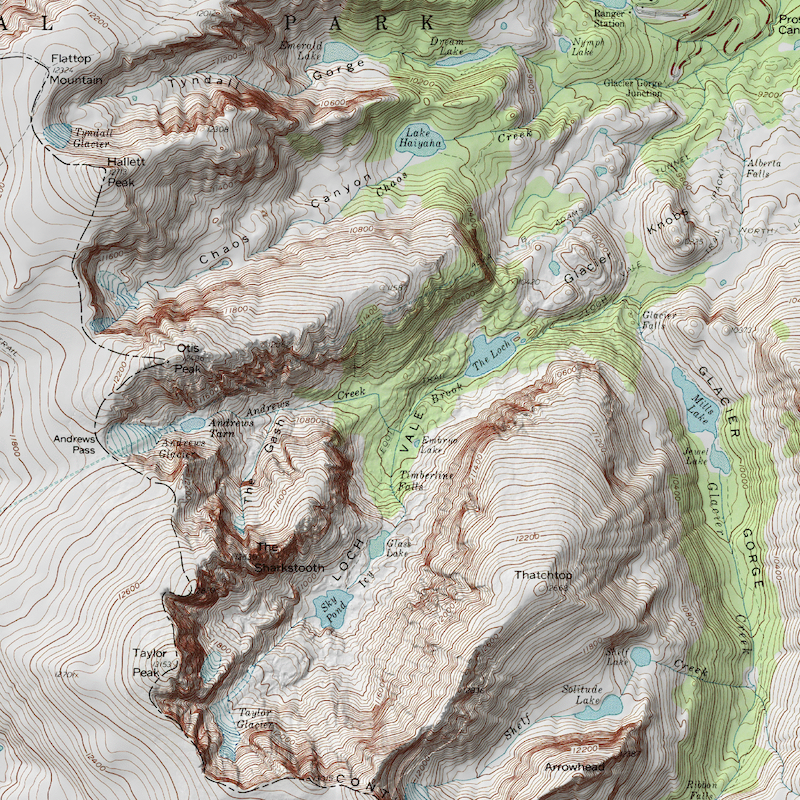
Enhanced Relief
Enhanced Relief uses a server-side multiply blend on the other map layers, rather than an opacity based compositing like Normal. The advantage of this approach is that, although it appears darker as a stacked layer, you can crank it way up without washing other layers out. This makes it a great choice to use with aerial imagery to add relief shading without losing the contrast and sharpness of the image.
This layer does not function on its own. It needs another layer to display, and thus should be stacked with another layer. See the Working with Base Layers lesson for more details.
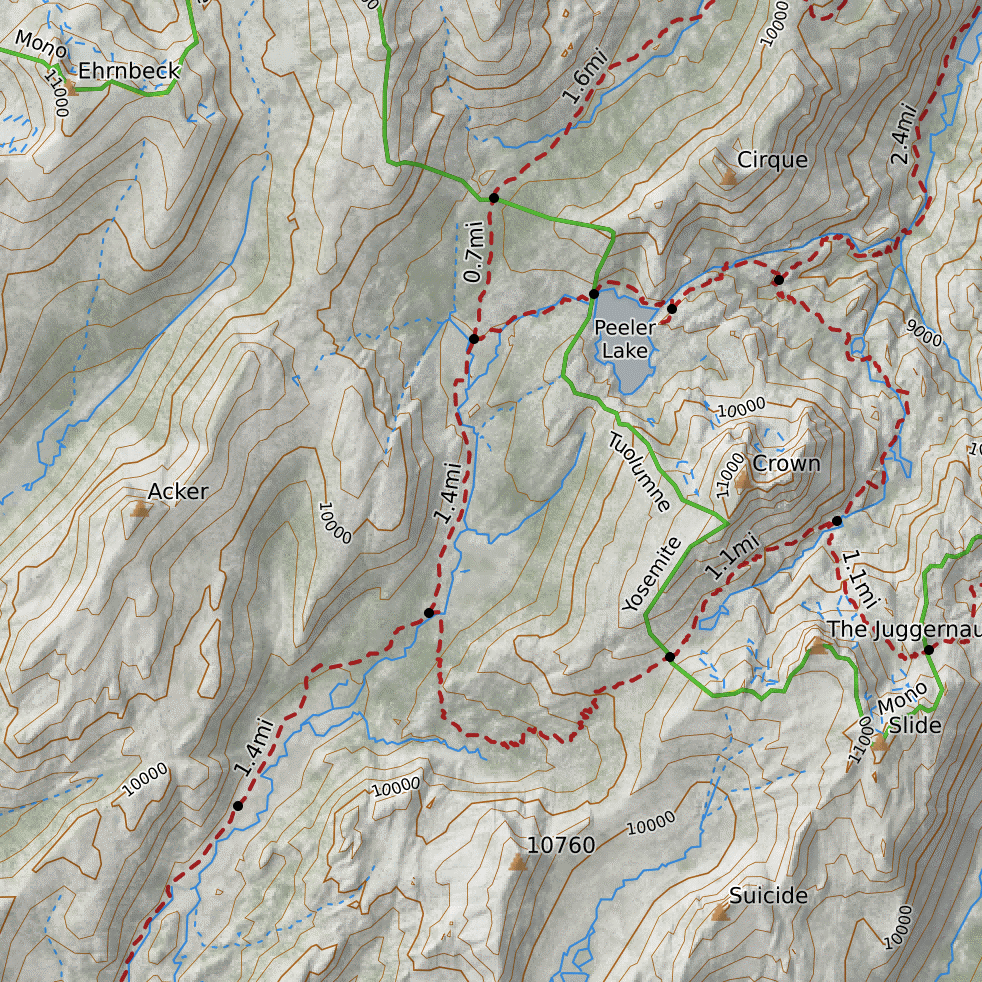
Terrain Shading
Terrain Shading uses 6 evenly spaced light sources in addition to the typical single 315 degree (NW) angle used in Normal and Enhanced shaded relief. Because of the multiple angles used, there is no “up” or “down”, and the map can be viewed from any angle without playing tricks on the eye. The downside is that in some areas it can be hard for the eye to quickly distinguish up from down.
This layer does not function on its own. It needs another layer to display, and thus should be stacked with another layer. See the Working with Base Layers lesson for more details.