Working with Existing Lines and Polygons
in this lesson
After drawing and saving a line, you can access data about it for more information, or edit and convert it in a number of ways.
Topics on this Page:
After completing the initial line drawing, you can access it for more information about the line or edit and convert it in a number of ways.
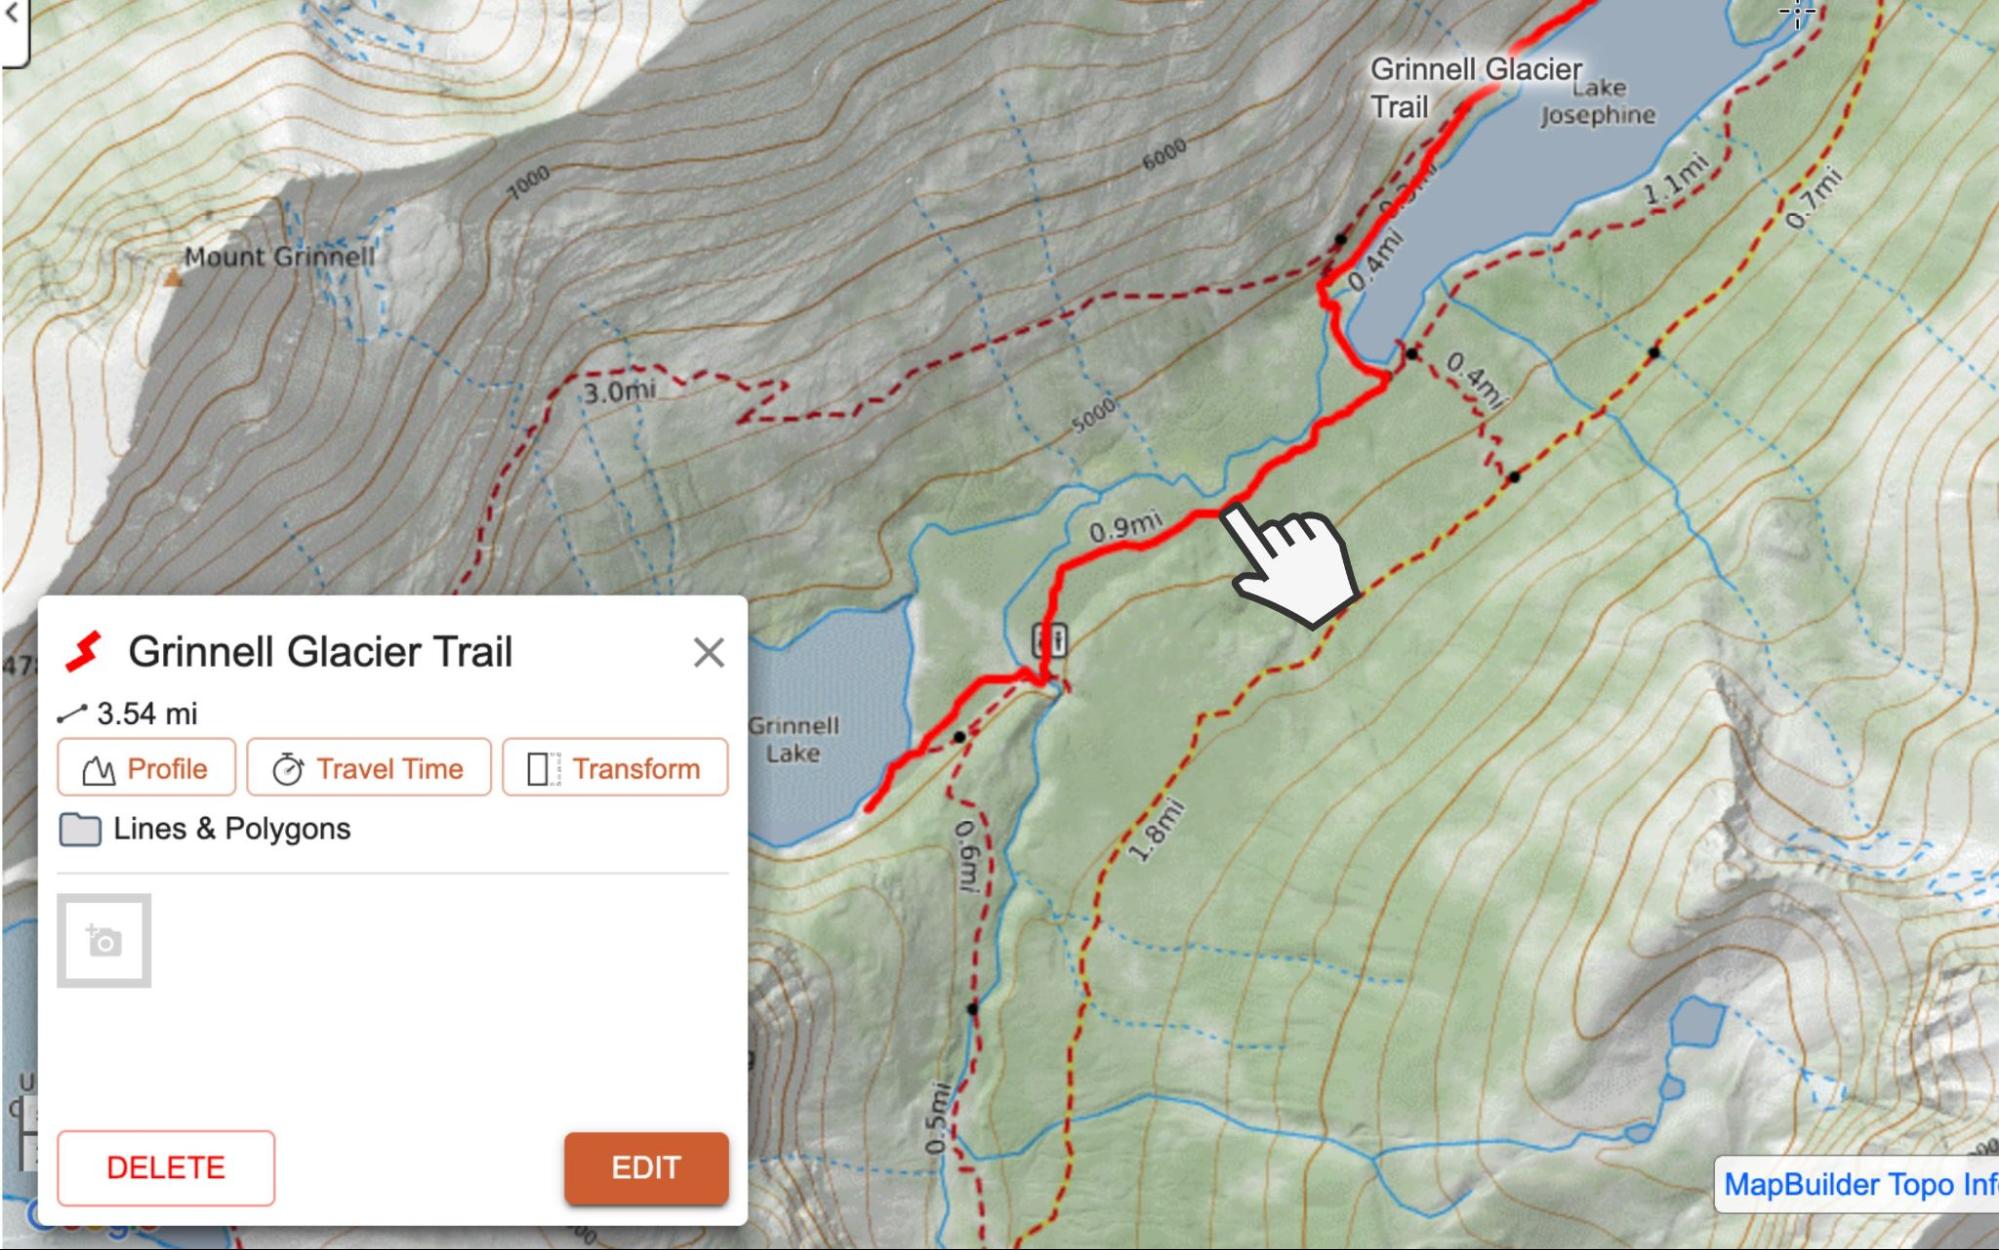
Access the line by clicking on it in the map viewer, or by clicking on its name in the object menu. The latter action will center the map on the line and adjust the zoom so the entire line is visible. A box will appear with links to options.
Editing Existing Lines
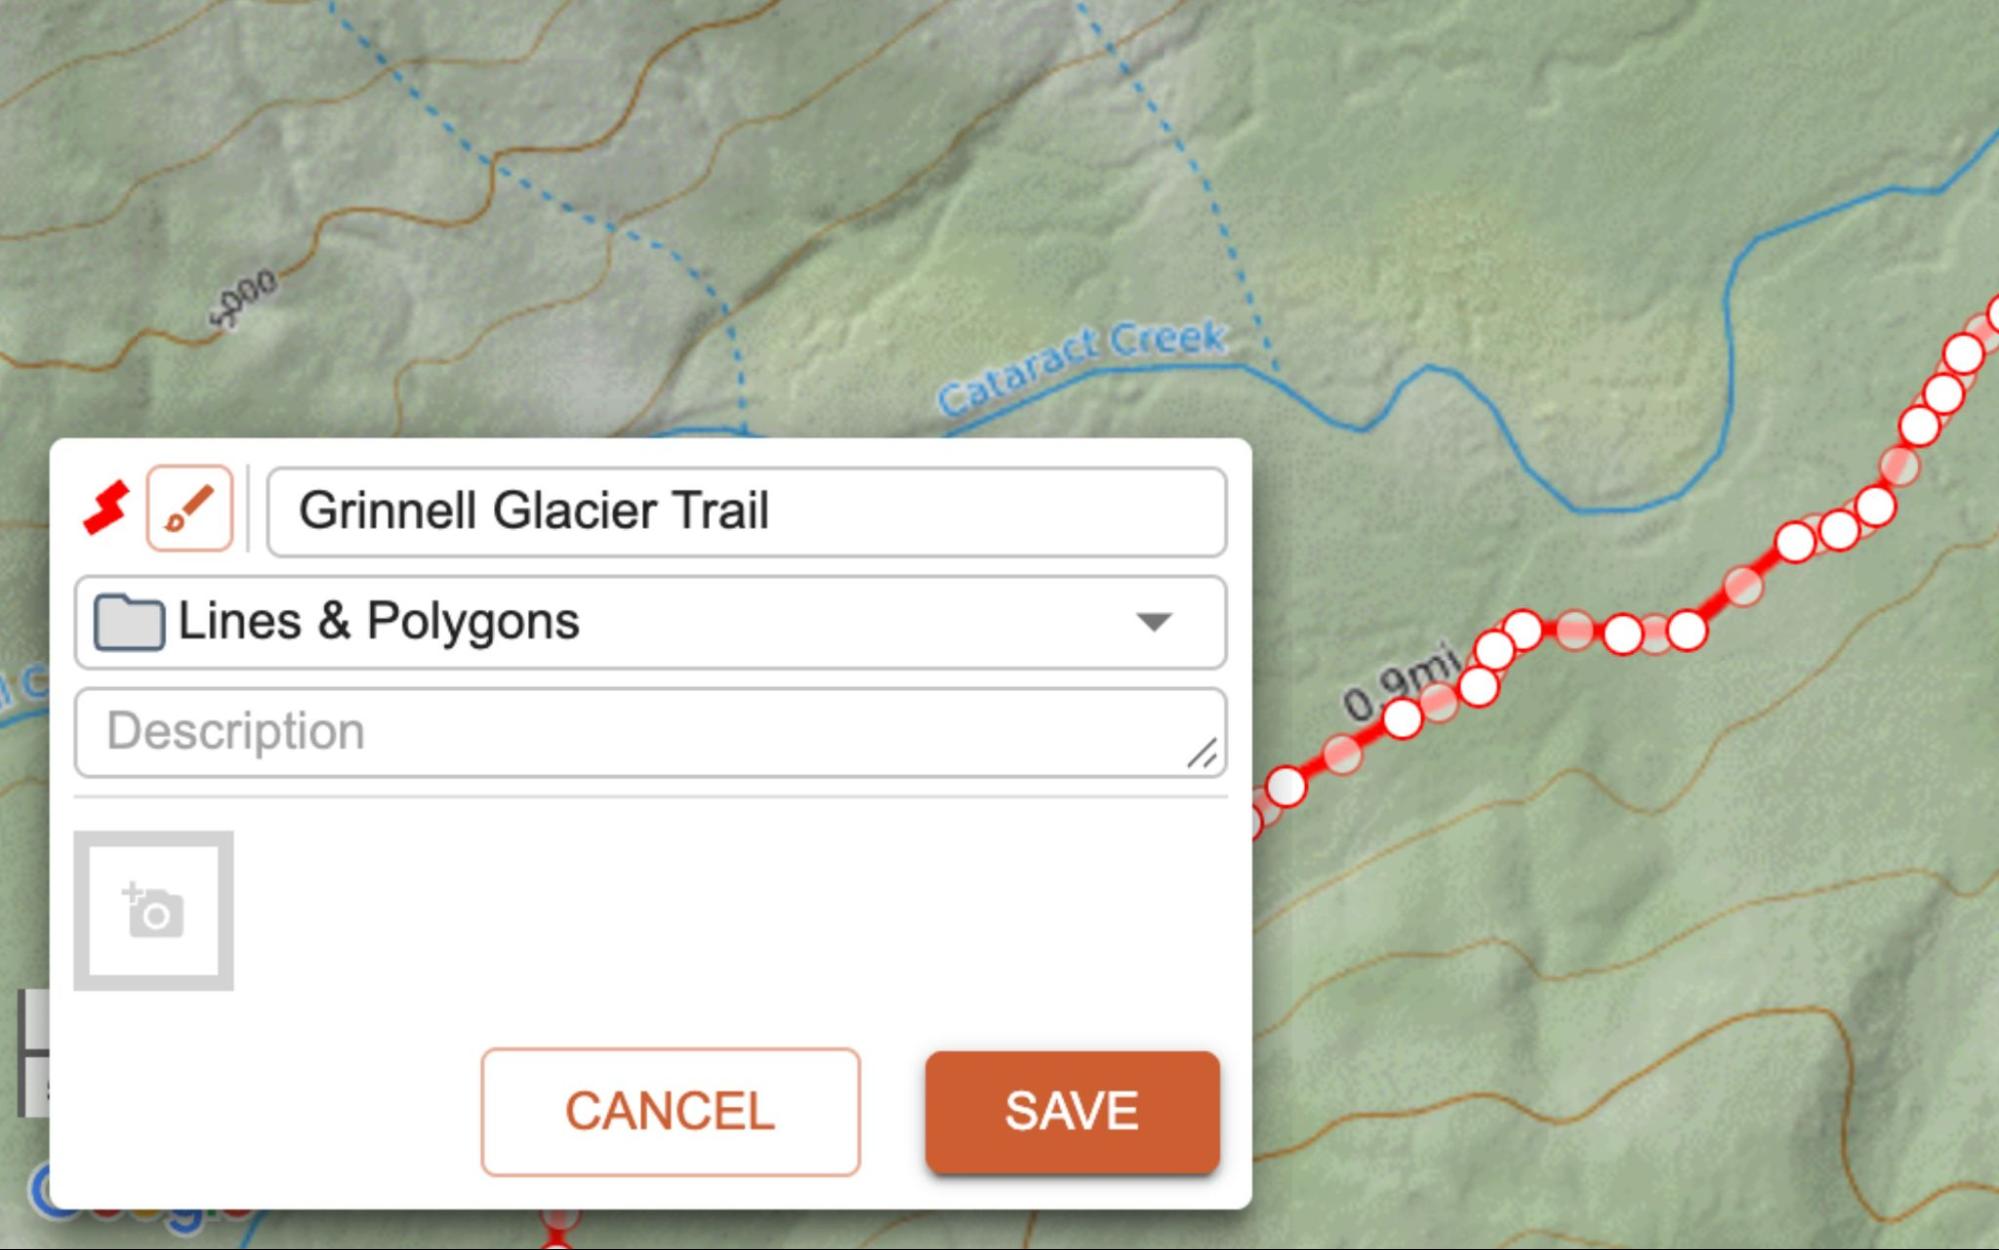
The edit link will open the edit panel for the line and show the vertices of the line. The edit box is the same as you worked with to draw the line. If you want to change any of the line attributes, you can do so here.
When the edit dialogue is open, you can also edit the points of the line on the map. Each dot represents a vertex of the line. Click and hold the mouse pointer on a vertex, and drag it to a new location to change the alignment of your line.
If your line contains too many vertices, it will display a warning in the edit box telling you that the line has too many points to edit, or would you like to edit anyway. The reason for this is that having a lot of points can cause your browser to hang or perform poorly if they are all open for editing at once. You can risk it and edit anyway, but expect to wait extra time between changes or that the changes might pile up and not save. To avoid this, you can use one of the tasks described below, such as resample or split the line, then edit it.
You may need to zoom way in to see individual vertices when they are on top or near each other (see image below).
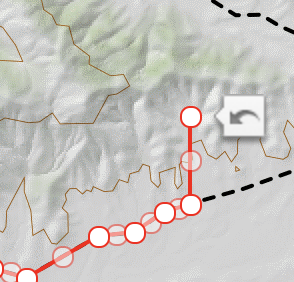
Save your changes to the line with the OK link in the edit box, or Cancel to discard your changes.
The Line Profile
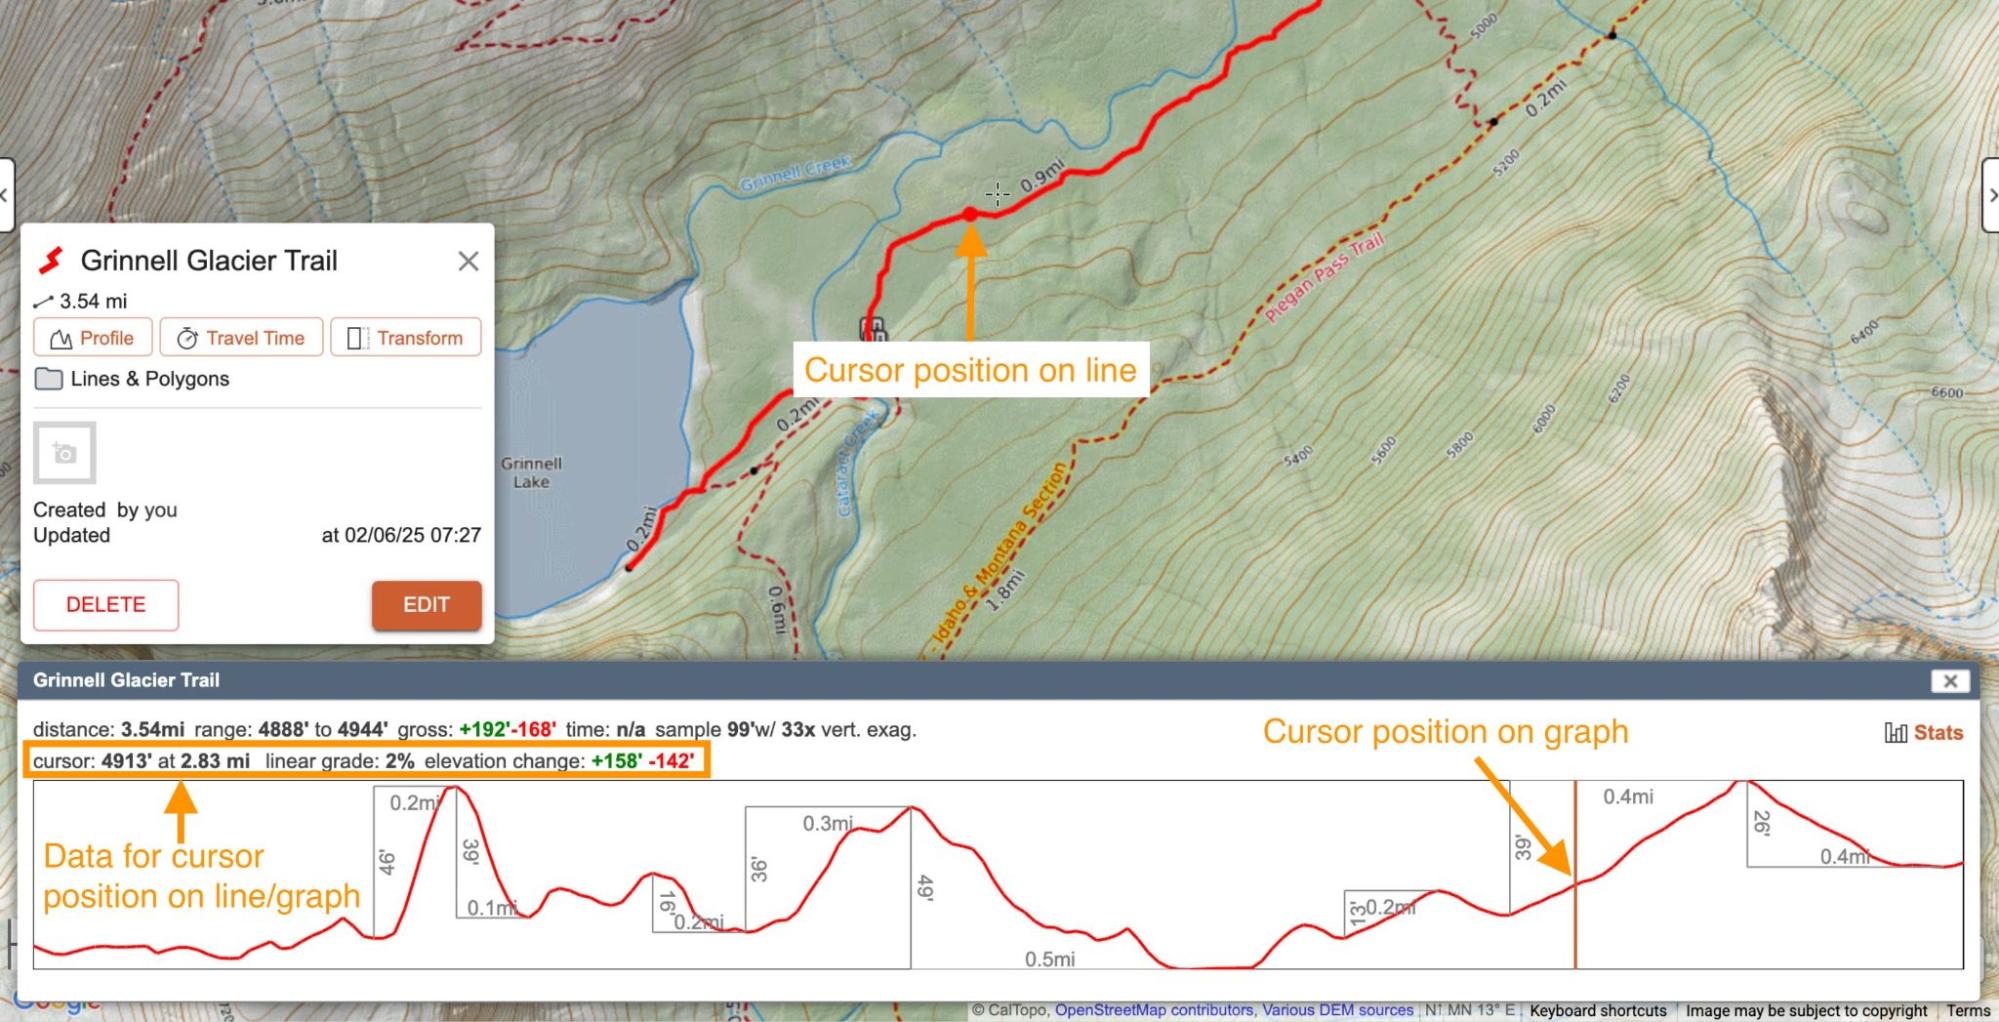
Profile displays the change in elevation over the distance of the line. If you move along the elevation profile with your cursor, a small dot will appear on the map and show you exactly where that is on the map.
There are two rows of information in the upper part of the profile box. The top row gives you information about the entire line. From left to right on that top row you get; total line distance, lowest point and highest point of the line (web only), the total elevation gain and loss calculated along the line, how often a point along the line is evaluated to be represented on the graph (web only), and the amount the vertical is exaggerated relative to the horizontal (web only).
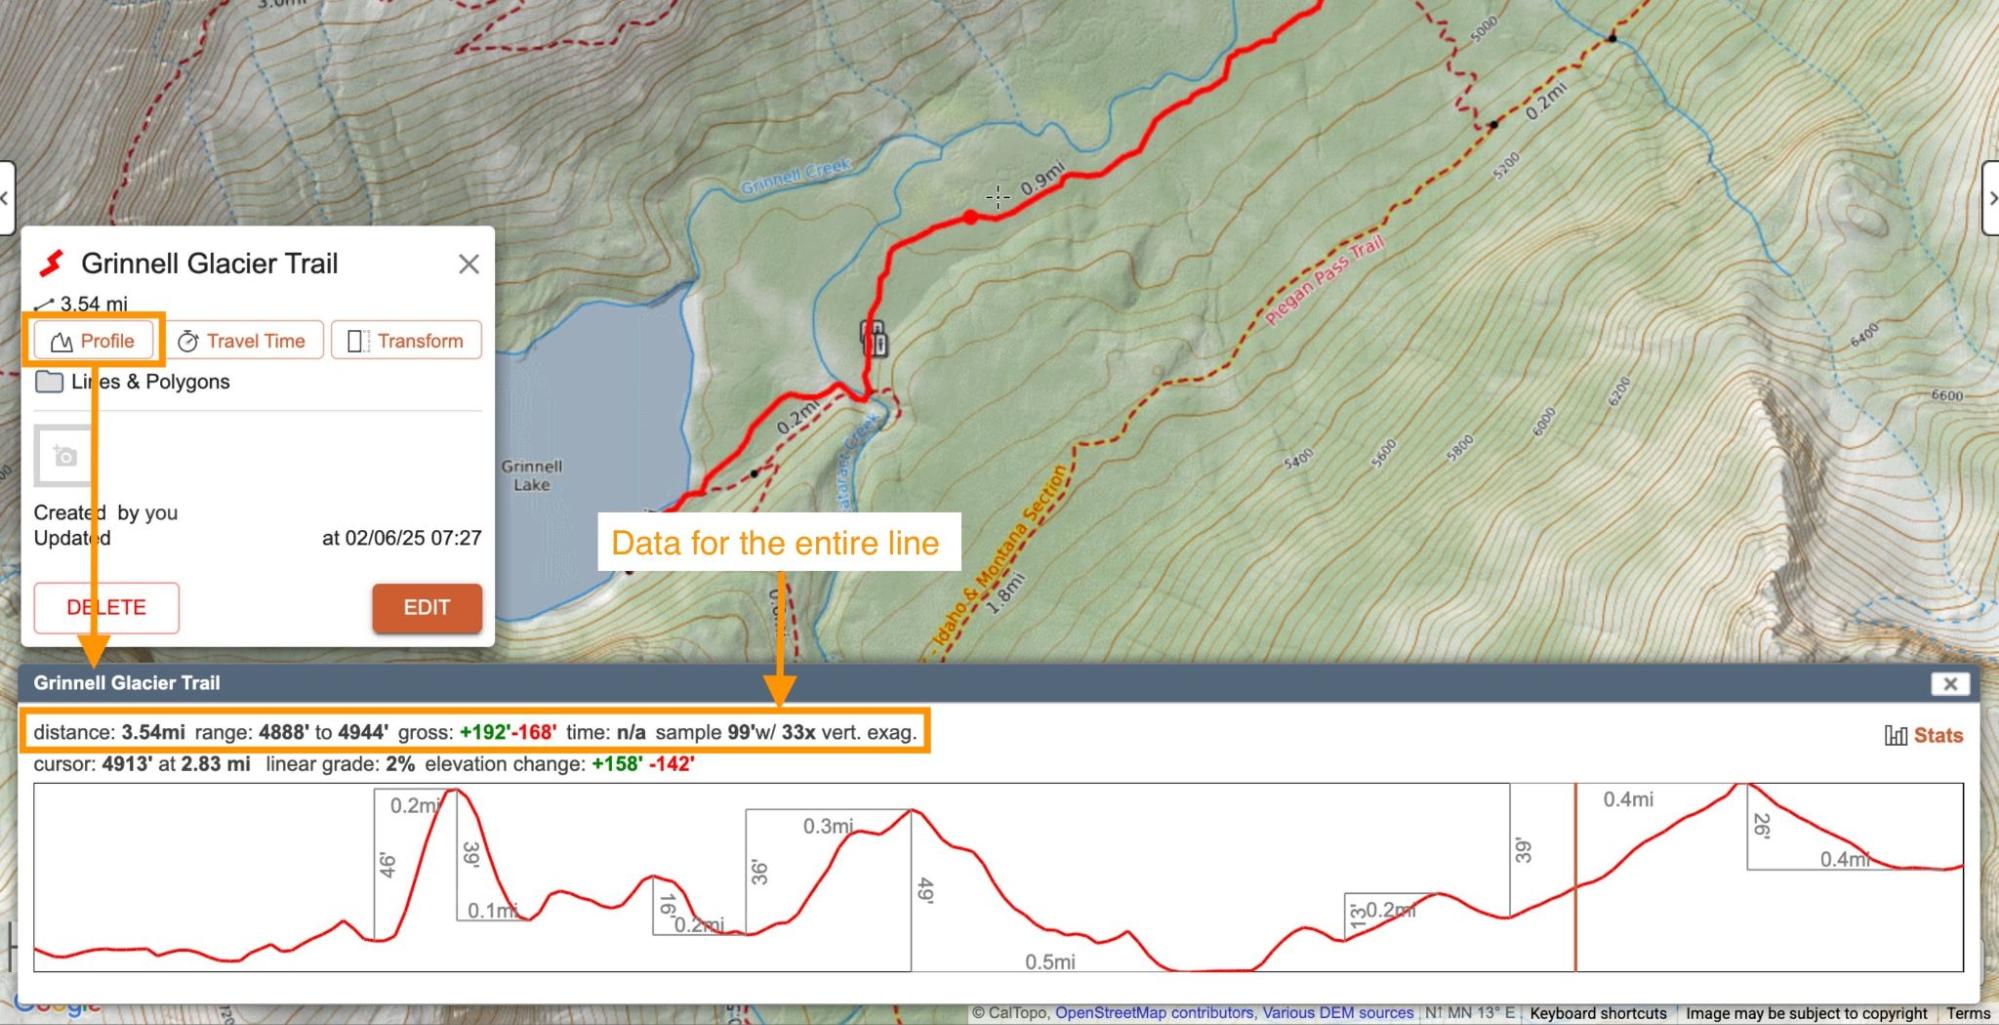
The second row gives you information about a point along the line. As you move your mouse cursor or drag your finger along the line within the profile box, a vertical orange line represents where you are on the line and is paired with a dot on the line in the map viewer. From left to right this is the information you get about that point; elevation at that point, distance of that point from the start of the line, linear grade at that point (web only), and the amount of elevation gained and/or lost up to that point.
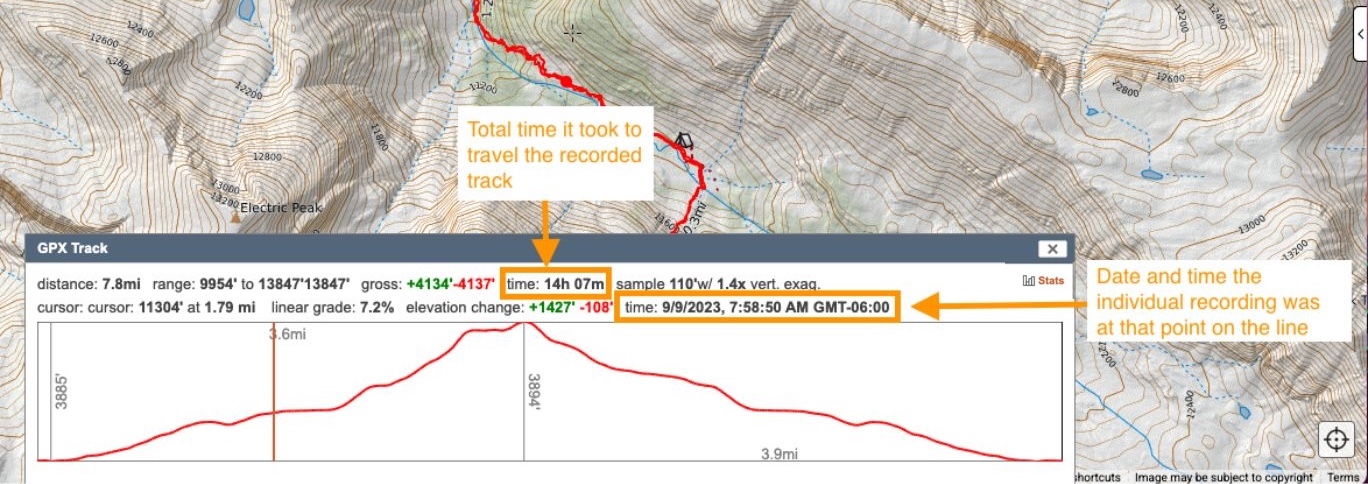
For many lines that will be all the data you get but any line with time stamps will give you the time you were at that point. Lines with time stamps are tracks recorded with the CalTopo mobile app or another GPS device or app. The time you get is recorded in UTC (Coordinated Universal Time), and then translated into your browser’s local time for display. So if you recorded a track from 1-2PM Pacific Standard Time, and then went home and looked at it in Eastern Standard Time, it would show 4-5pm Eastern Standard Time. Profiles for lines with time stamps will also include the total time it took to travel the recorded line in the top row and the time the individual recording the line was at that point on the line.
Along the graphed line are mini graphs indicating partial slopes and their elevation changes over a distance. Use the “Stats” link in the upper right to switch to a terrain statistics view. Use the X button or the OK button to close the profile and return to the map viewer.
Terrain Statistics
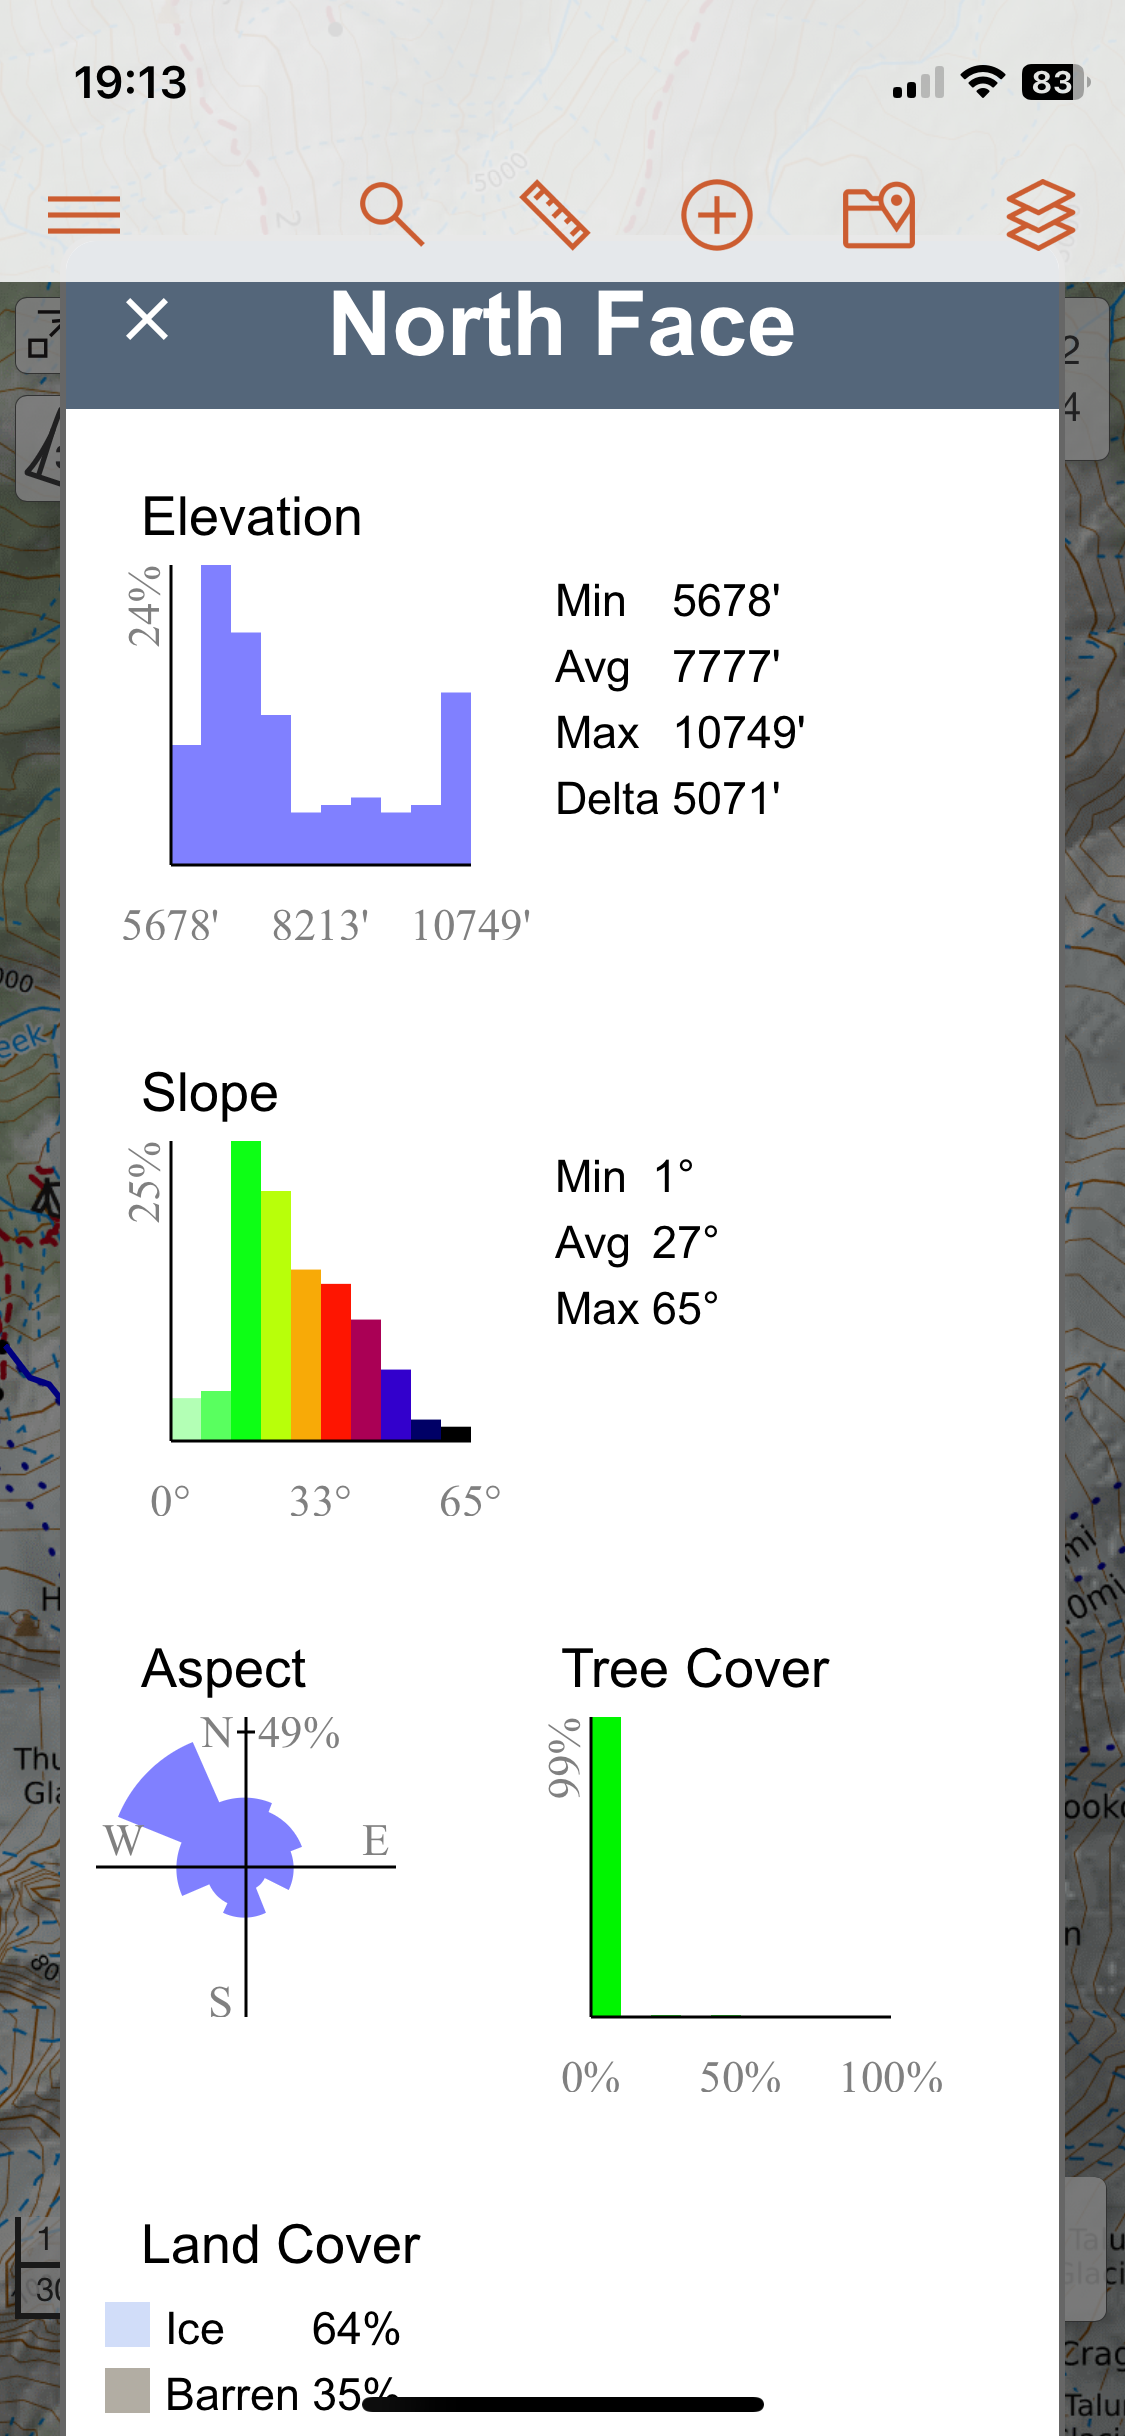
Terrain statistics displays the elevation profile similar to the profile box, although it's no longer interactive, and also includes graphs on elevation, slope, aspect, tree cover and land cover. This tool is useful for analyzing which parts of your line are steepest, have no tree cover, or are through wetland areas.
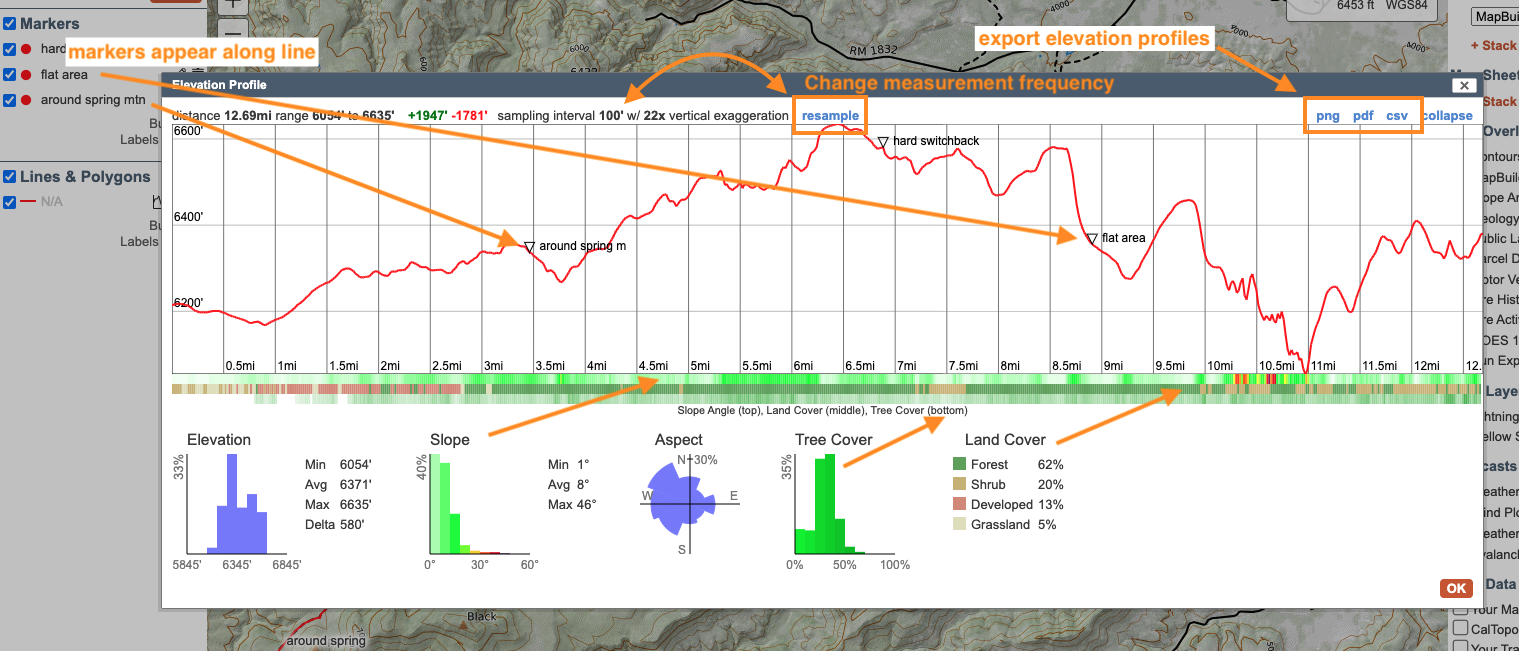
Pro, Desktop and Team accounts include an exportable elevation profile, as you see in the upper right corner of the statistic box. Next to the various exportable formats is a collapse link that moves you back to the profile-only box.
If you have markers set near your line, they will appear on the graph along with labels (if labels are turned on in Settings menu.)
Use terrain statistics to view more details about the landscape that the line traverses, as well as absolute elevation and changes in elevation. Aspect can be important for winter sports where sun direction matters, and tree cover and land cover could help you plan where to put your campsite or what areas you want to avoid during the hottest part of your day.
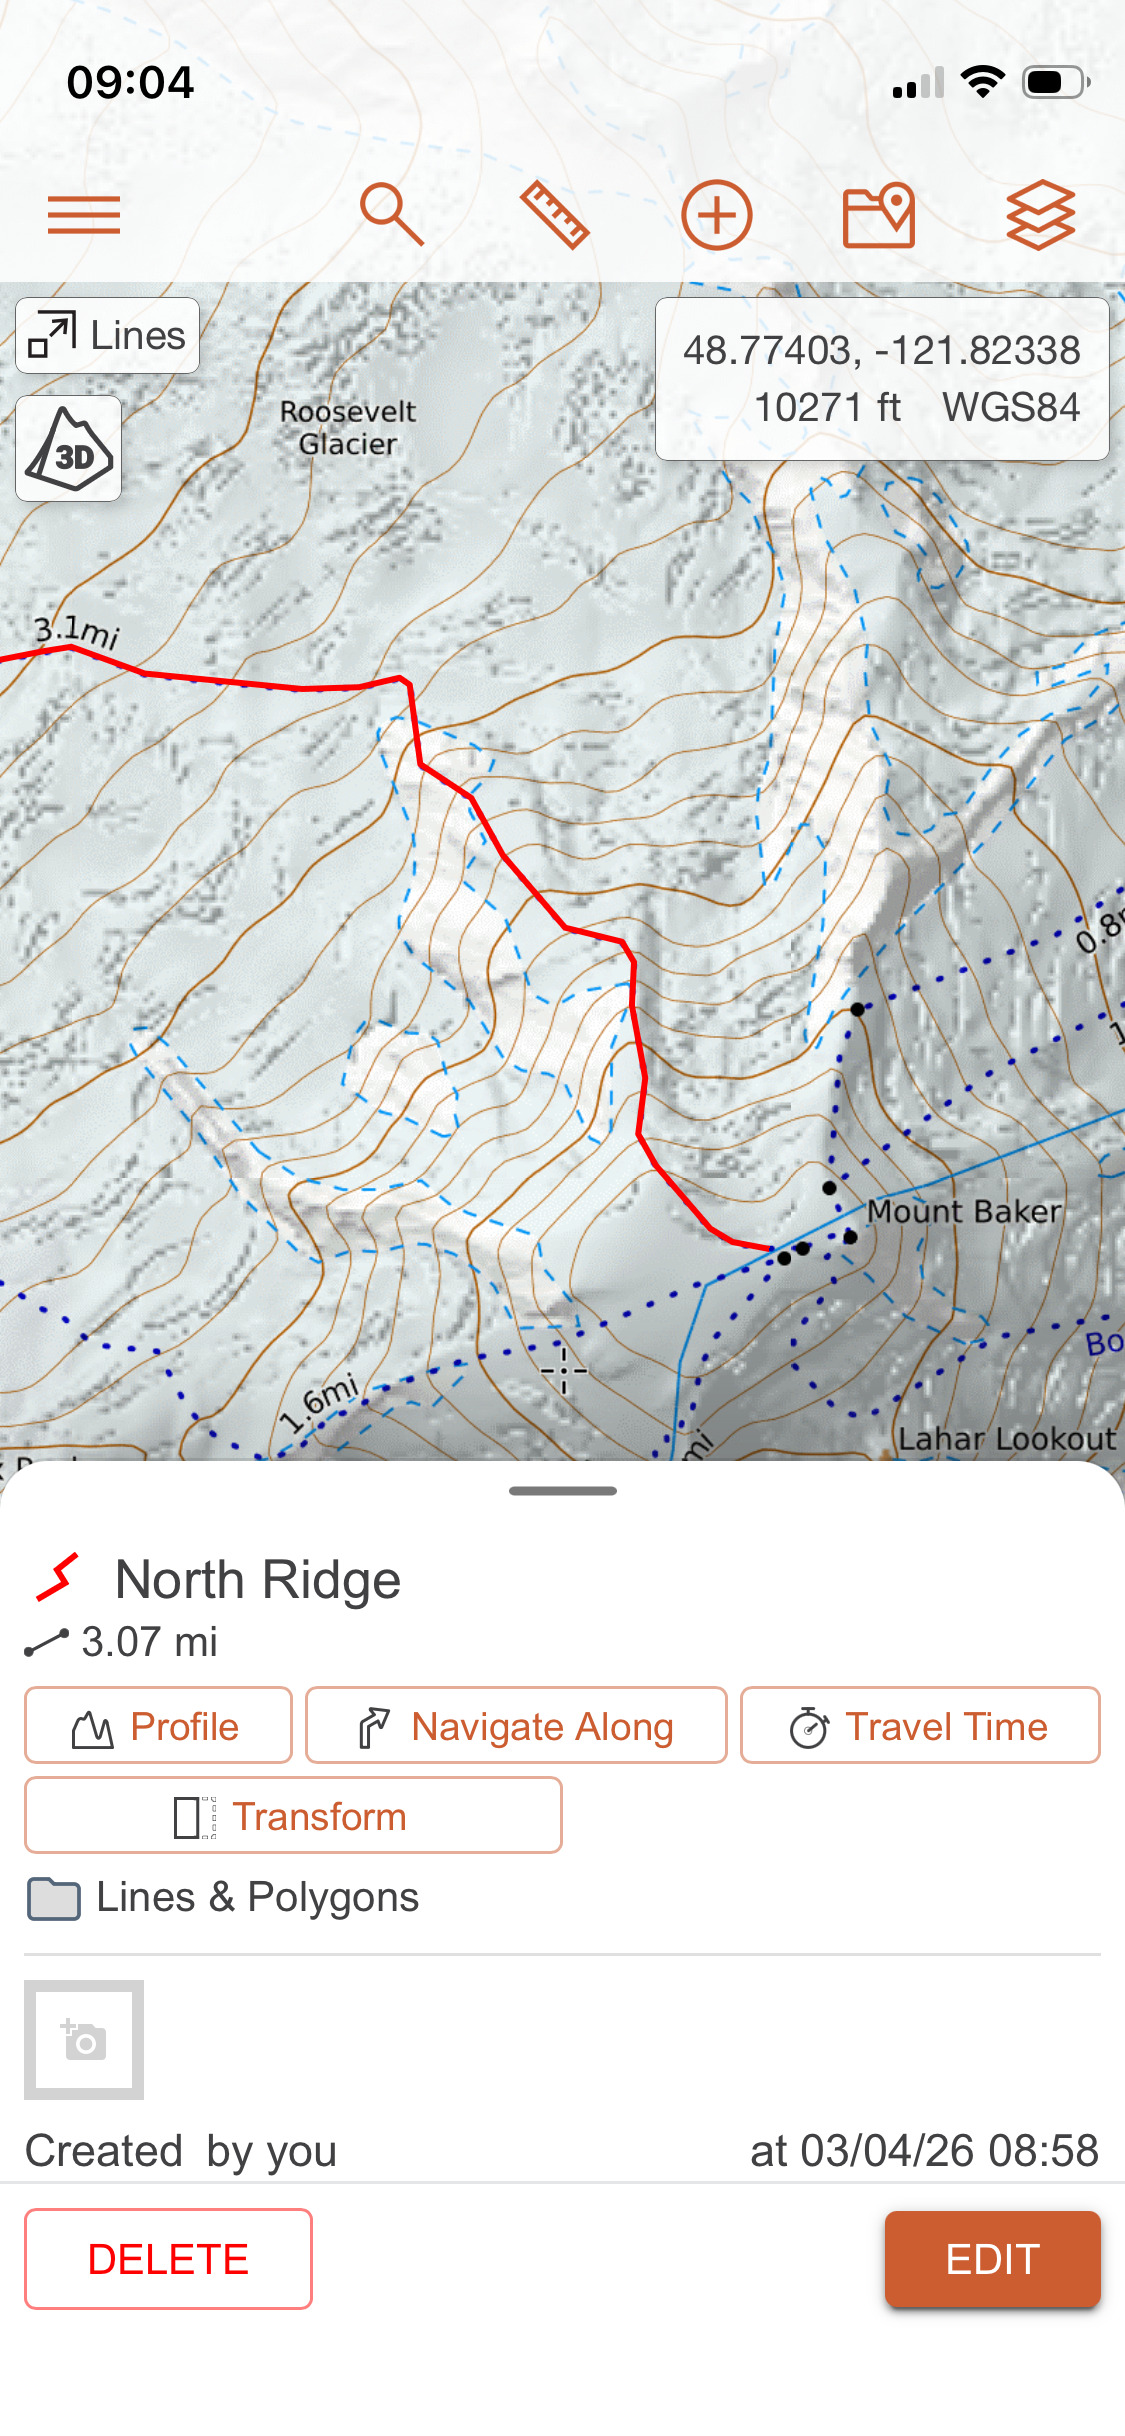
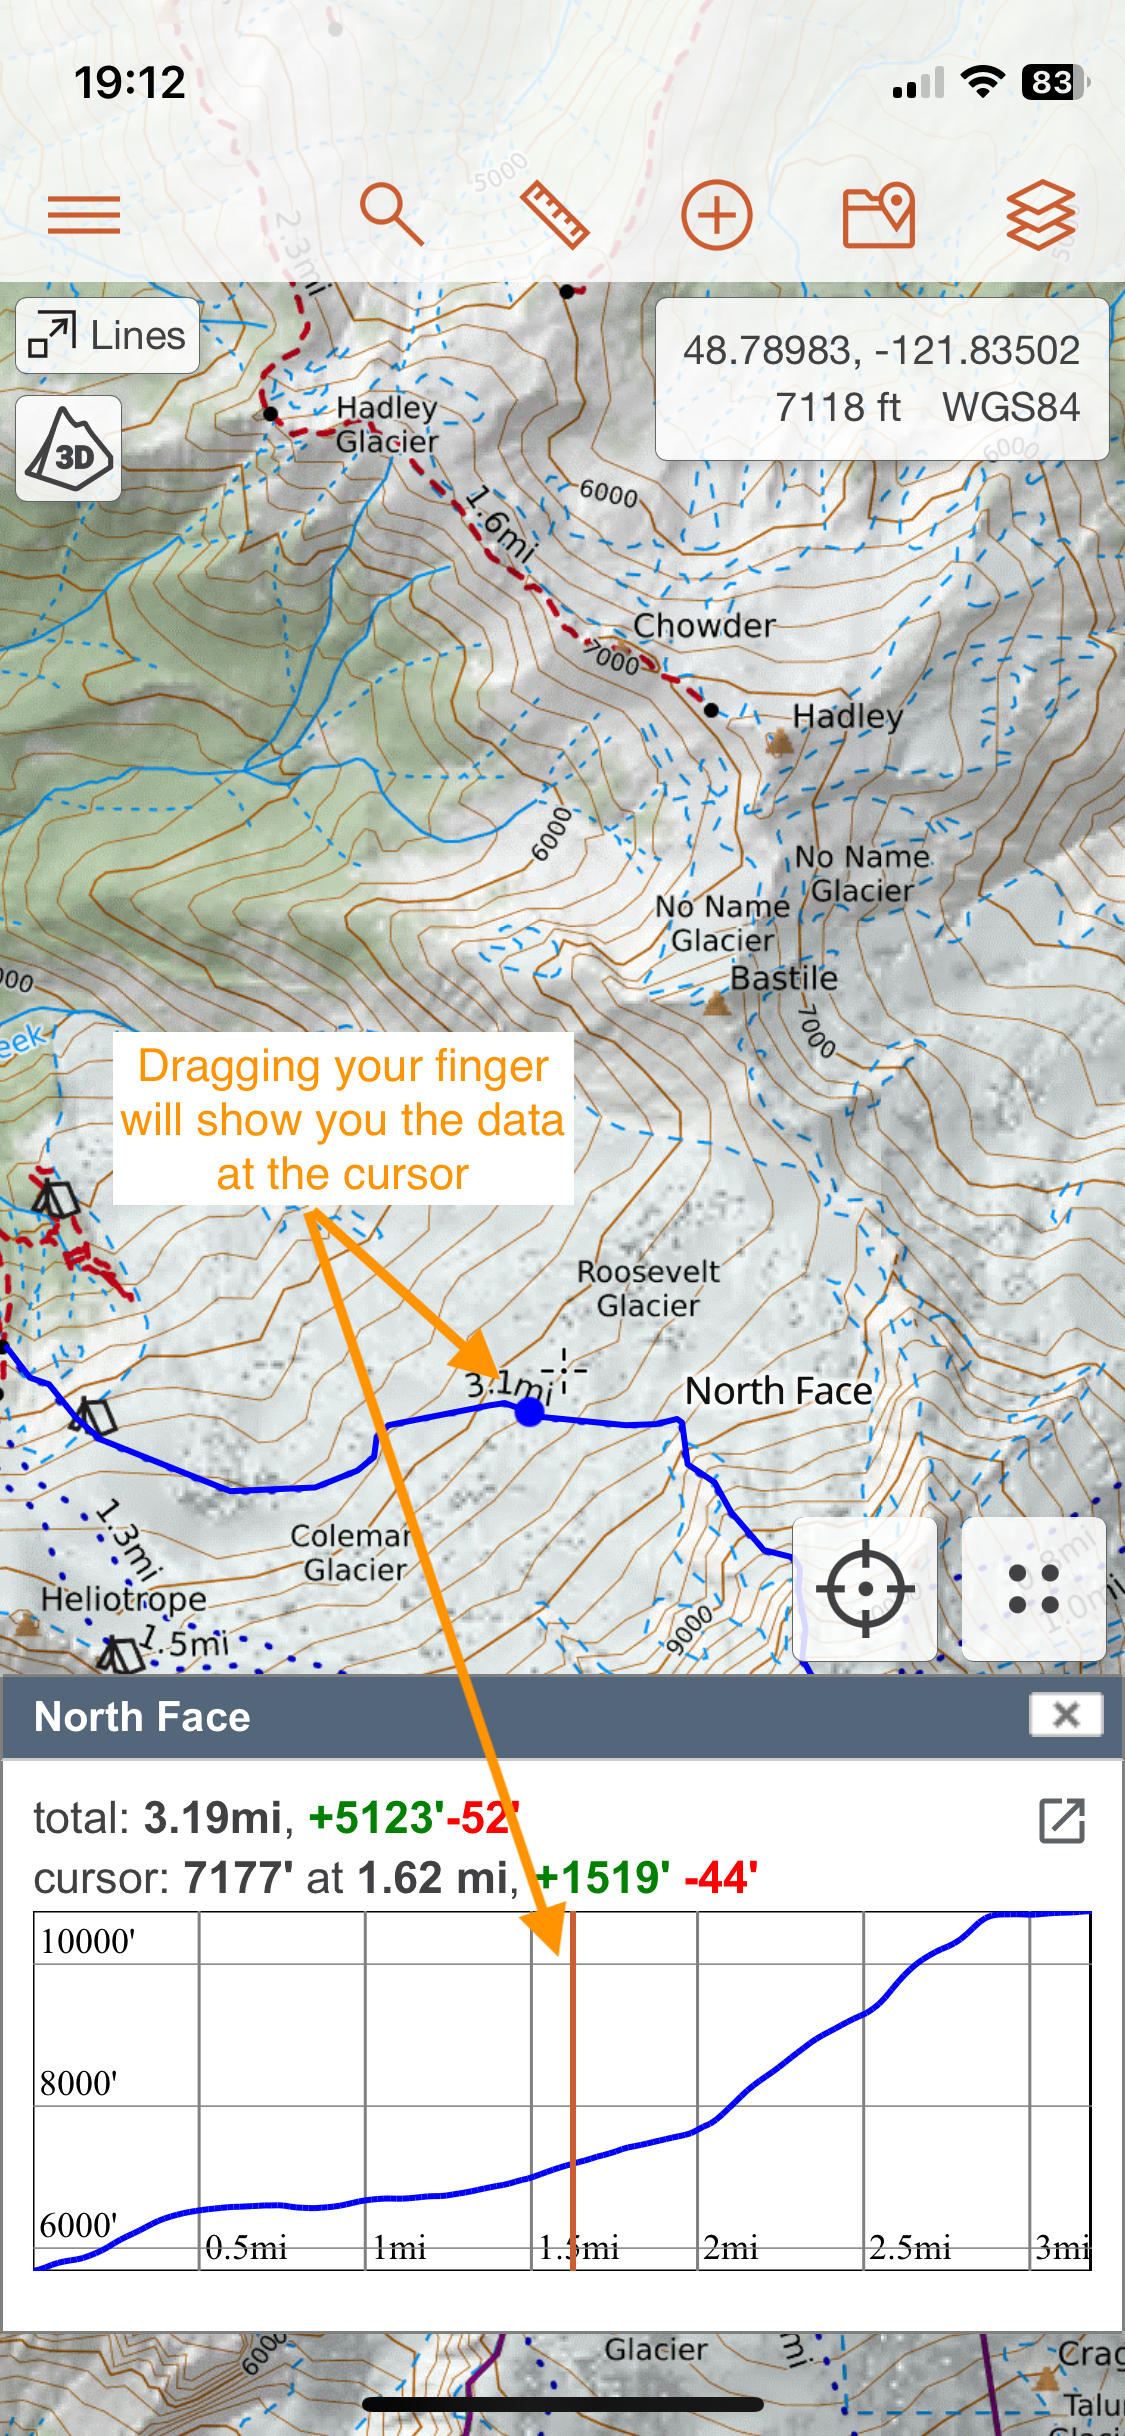
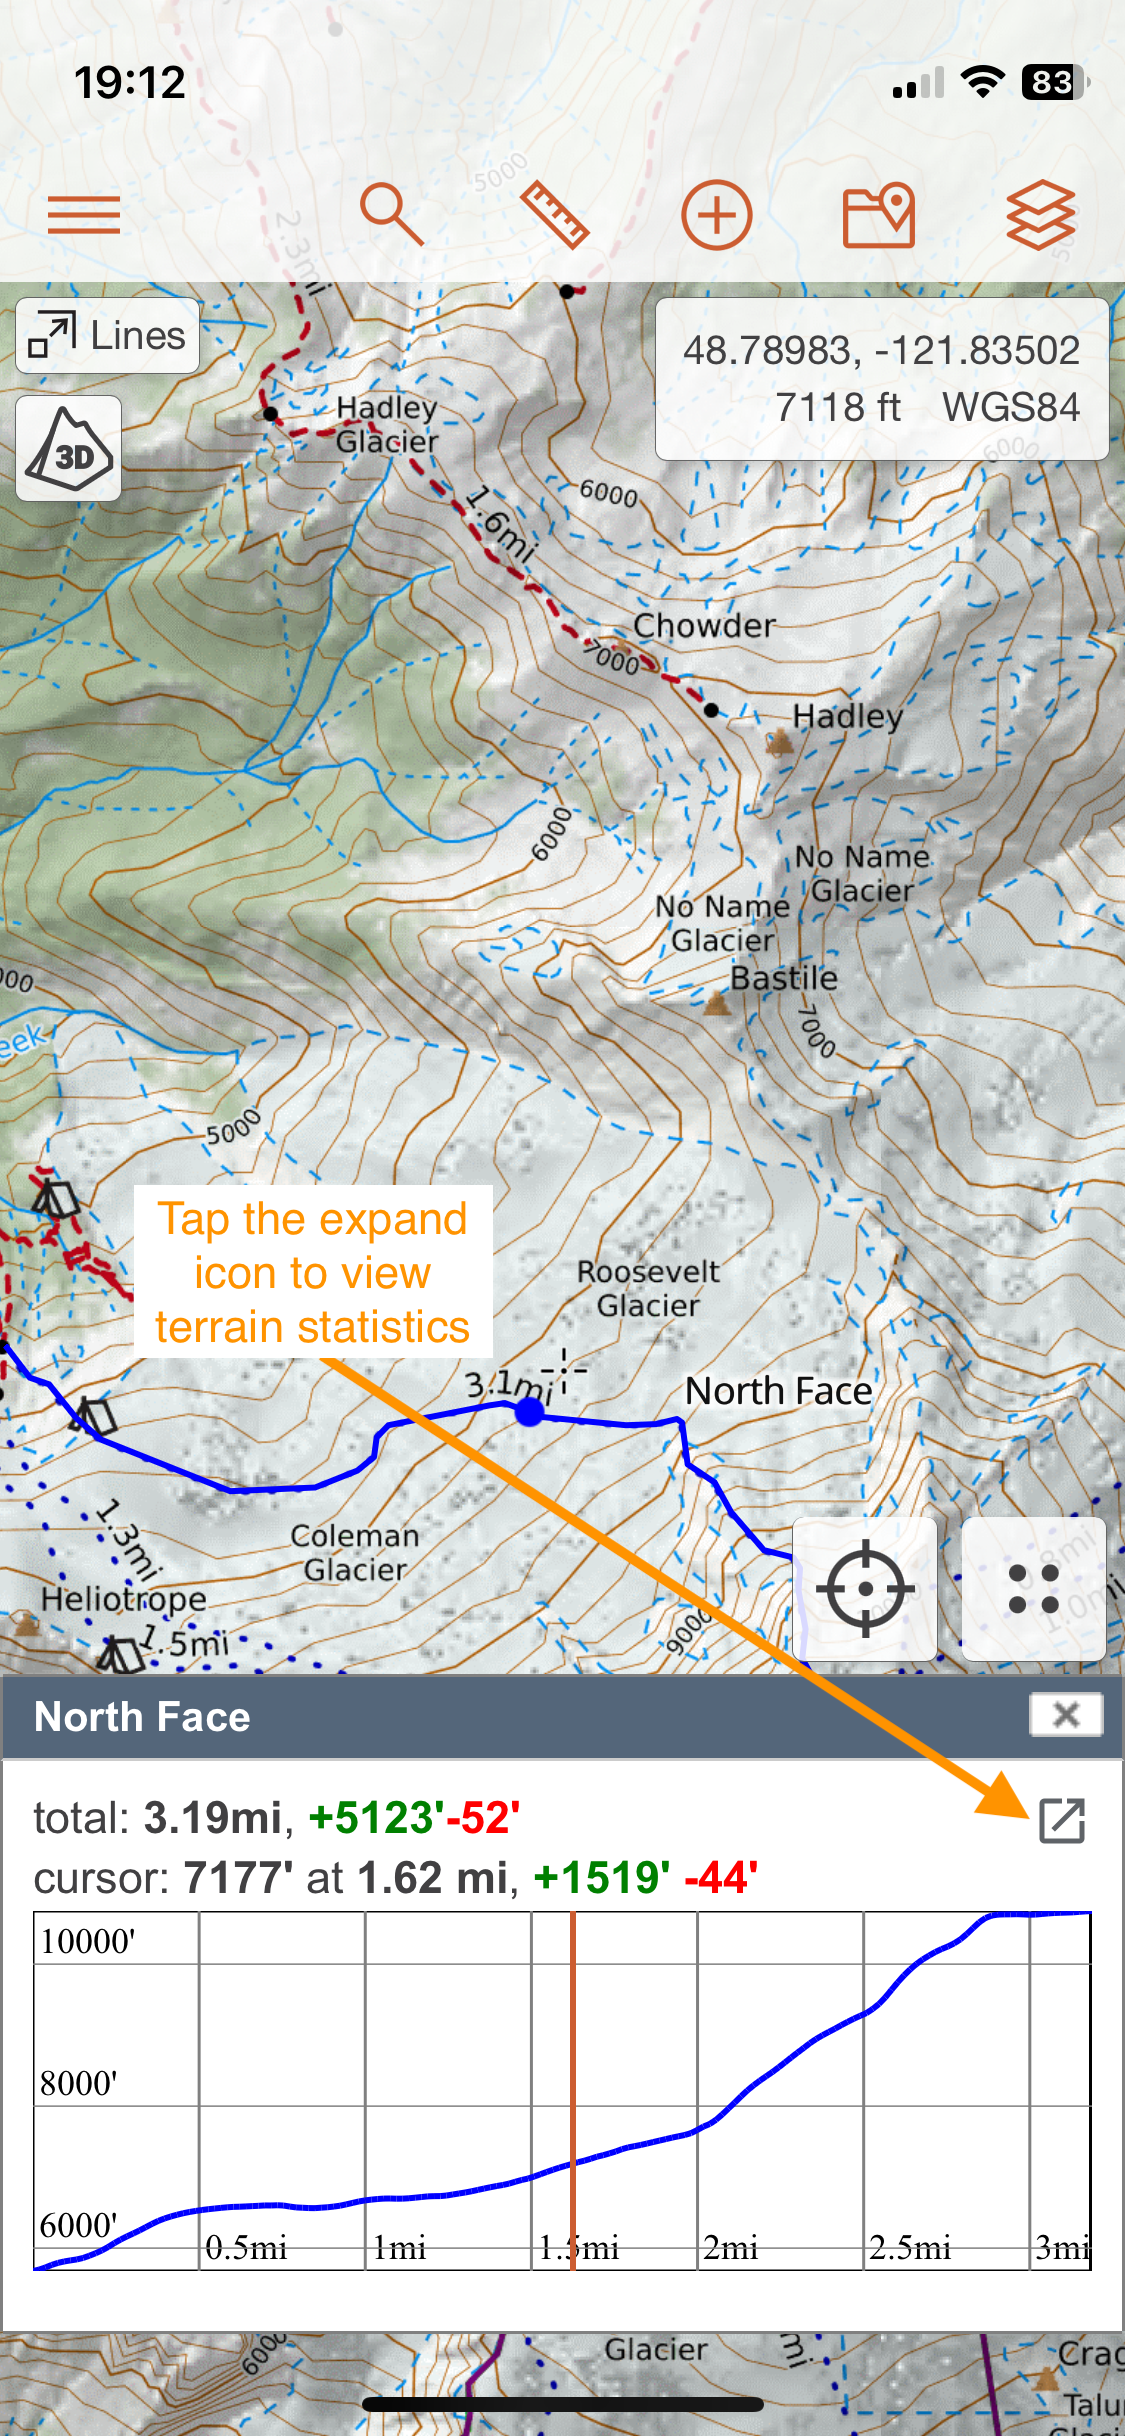
Mobile Line Profile
In the mobile app, the line profile is much the same as on the web. Tap the line and in the menu that opens tap profile.
Travel Time and Plan
Travel Time and Travel Plan allow you to generate and display information about estimated travel times using the Munter Method of Time Calculation. This is a popular method for estimating travel time through non-technical terrain that takes into account distance, elevation gain and loss and travel mode. To learn more about the Munter Method, please check out this page.
Travel Time
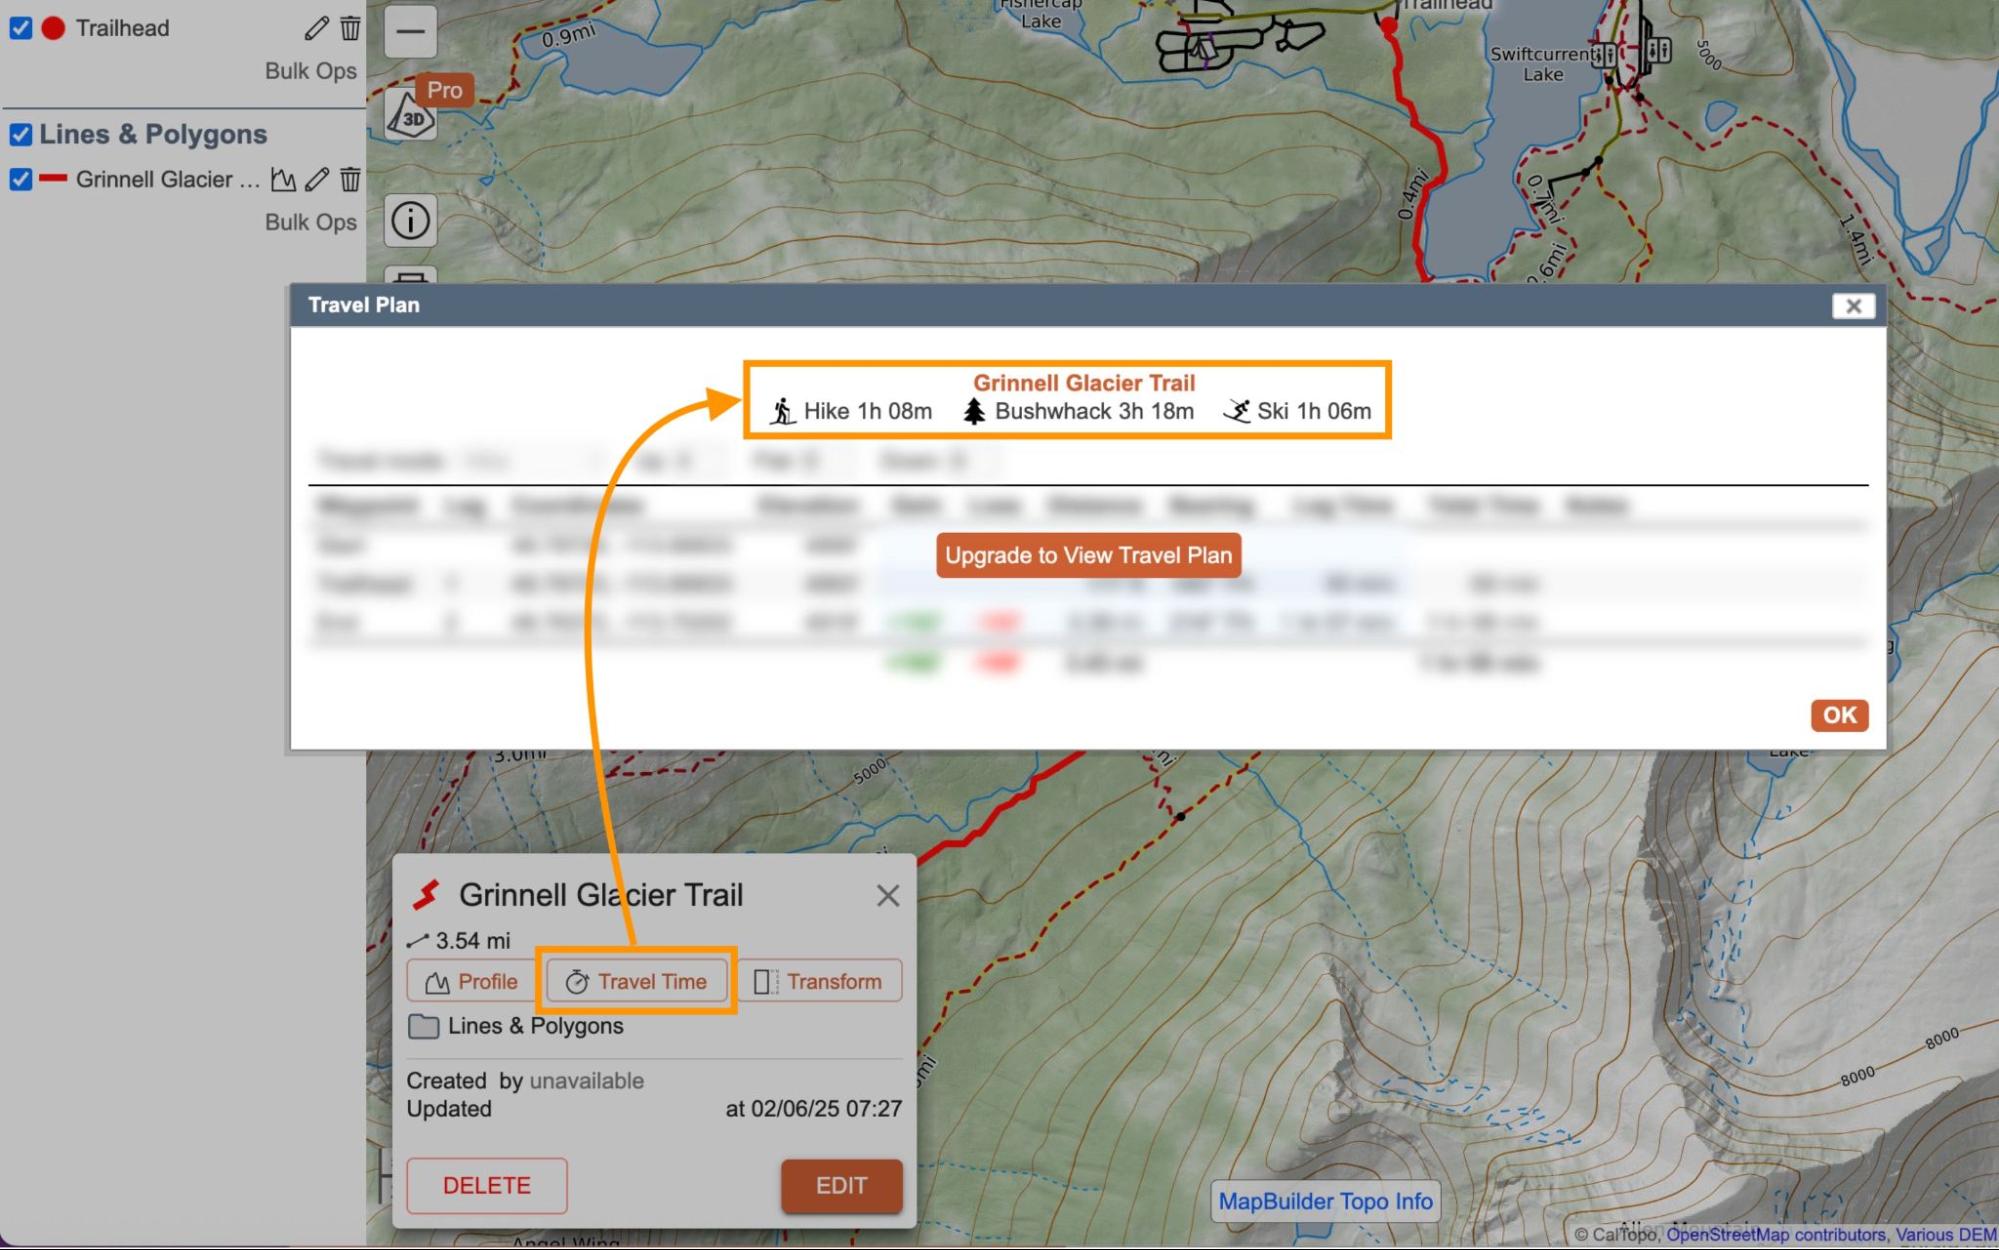
Selecting Travel Time for a line object displays estimated times to travel that line based on the mode of travel (hike, off trail and ski). These times appear in the a separate Travel Plan dialog.
Travel Plan
If you have a pro, desktop, team or enterprise account, you can go a step further and build a detailed travel plan for a single line (using the option in the line object dialog box) or multiple lines (using the Bulk Ops function).
Using Travel Plan for a Single Line
To create a travel plan for a single line, simply click on the Travel Time button in the line object dialog. A travel plan for the single line will appear below the estimated travel times.
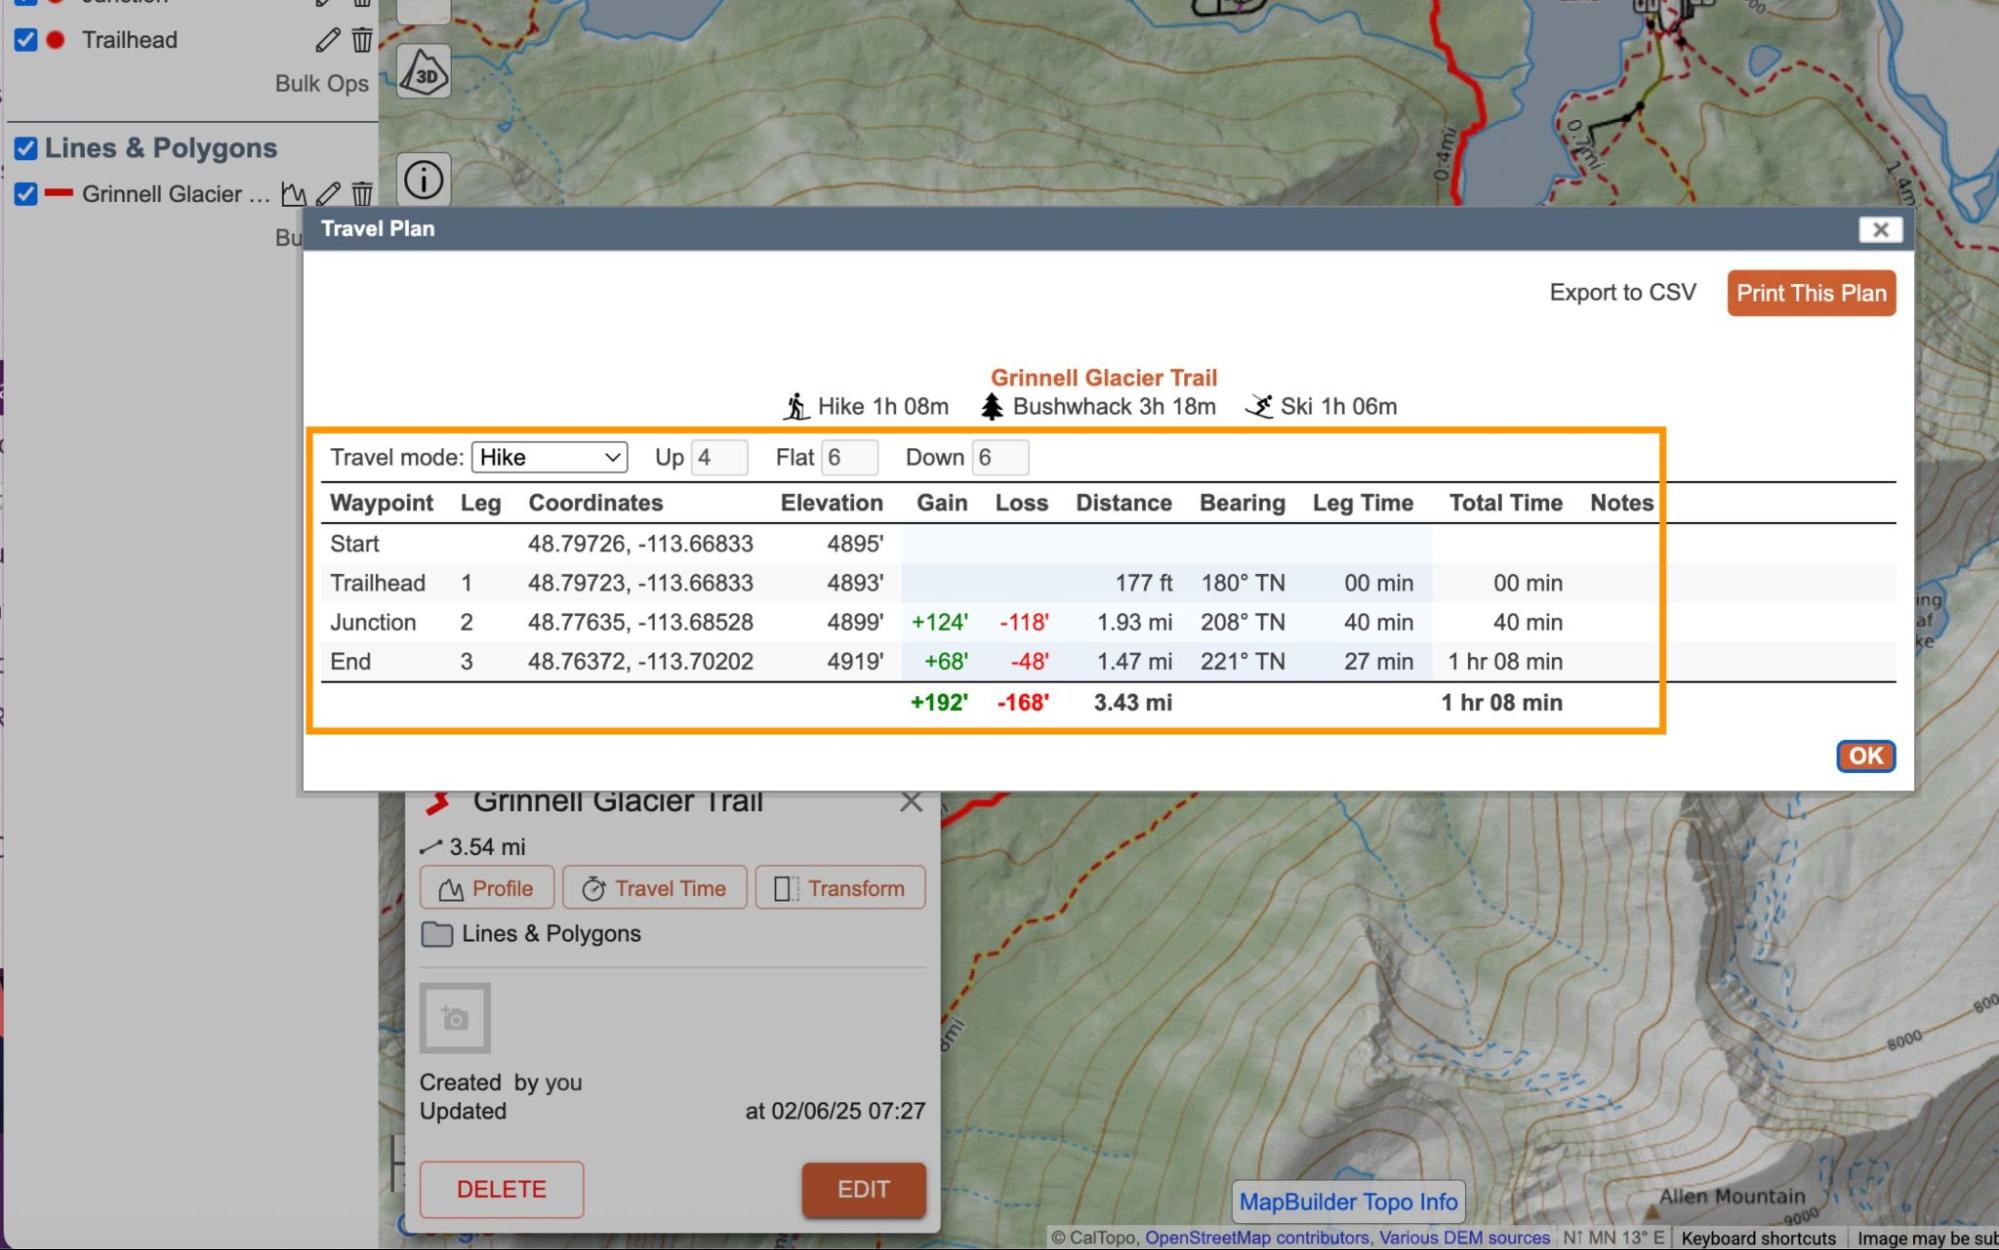
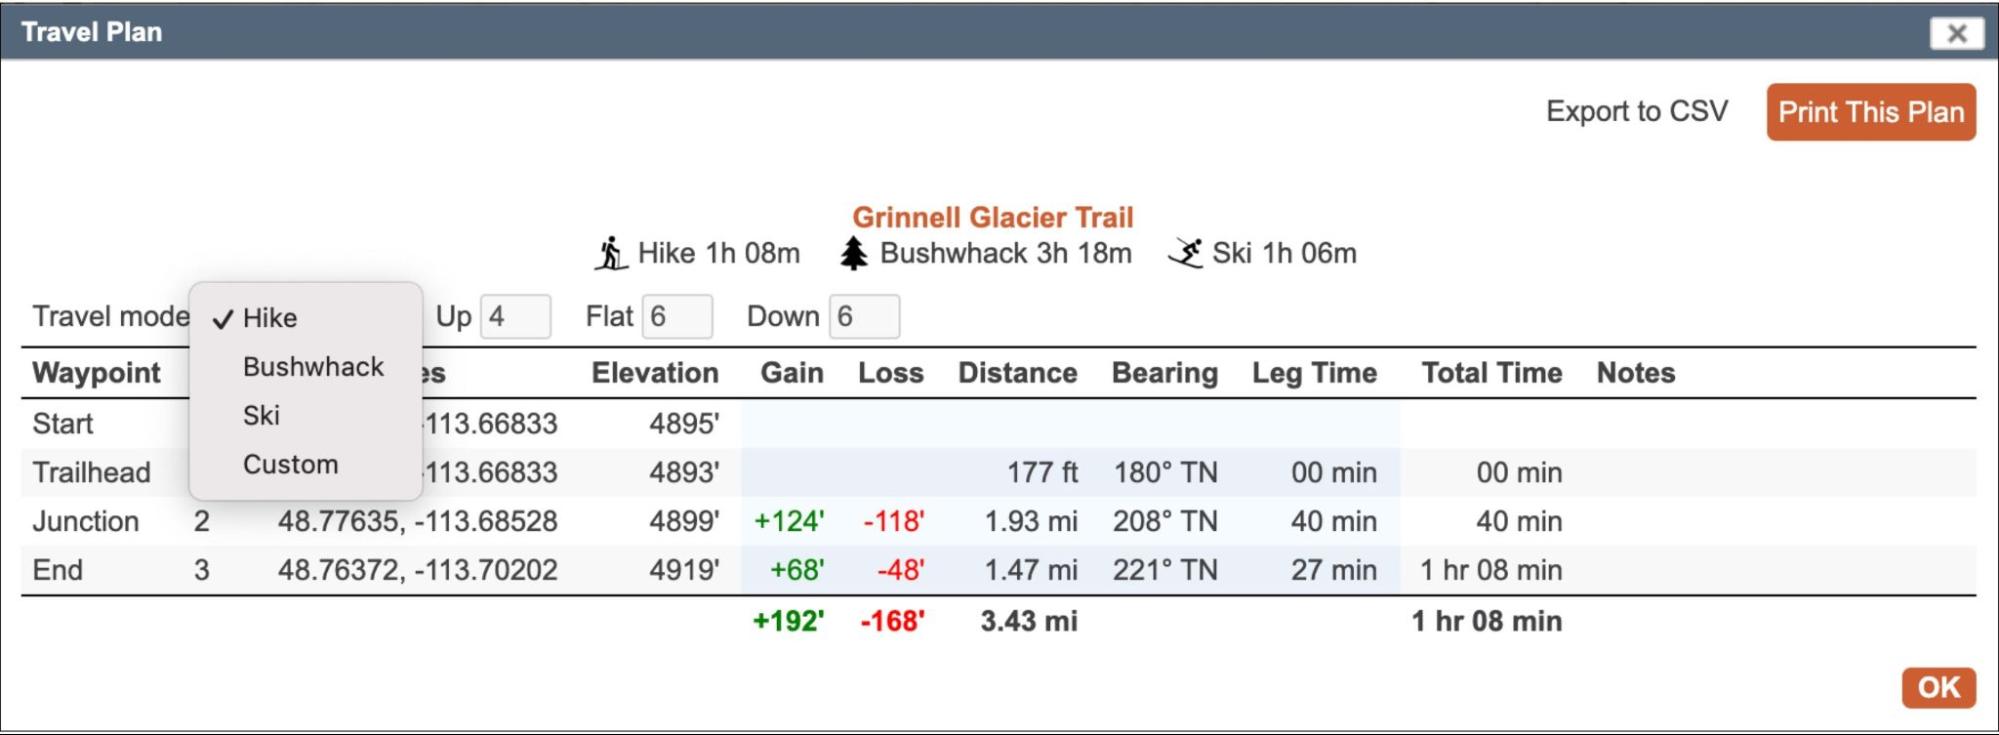
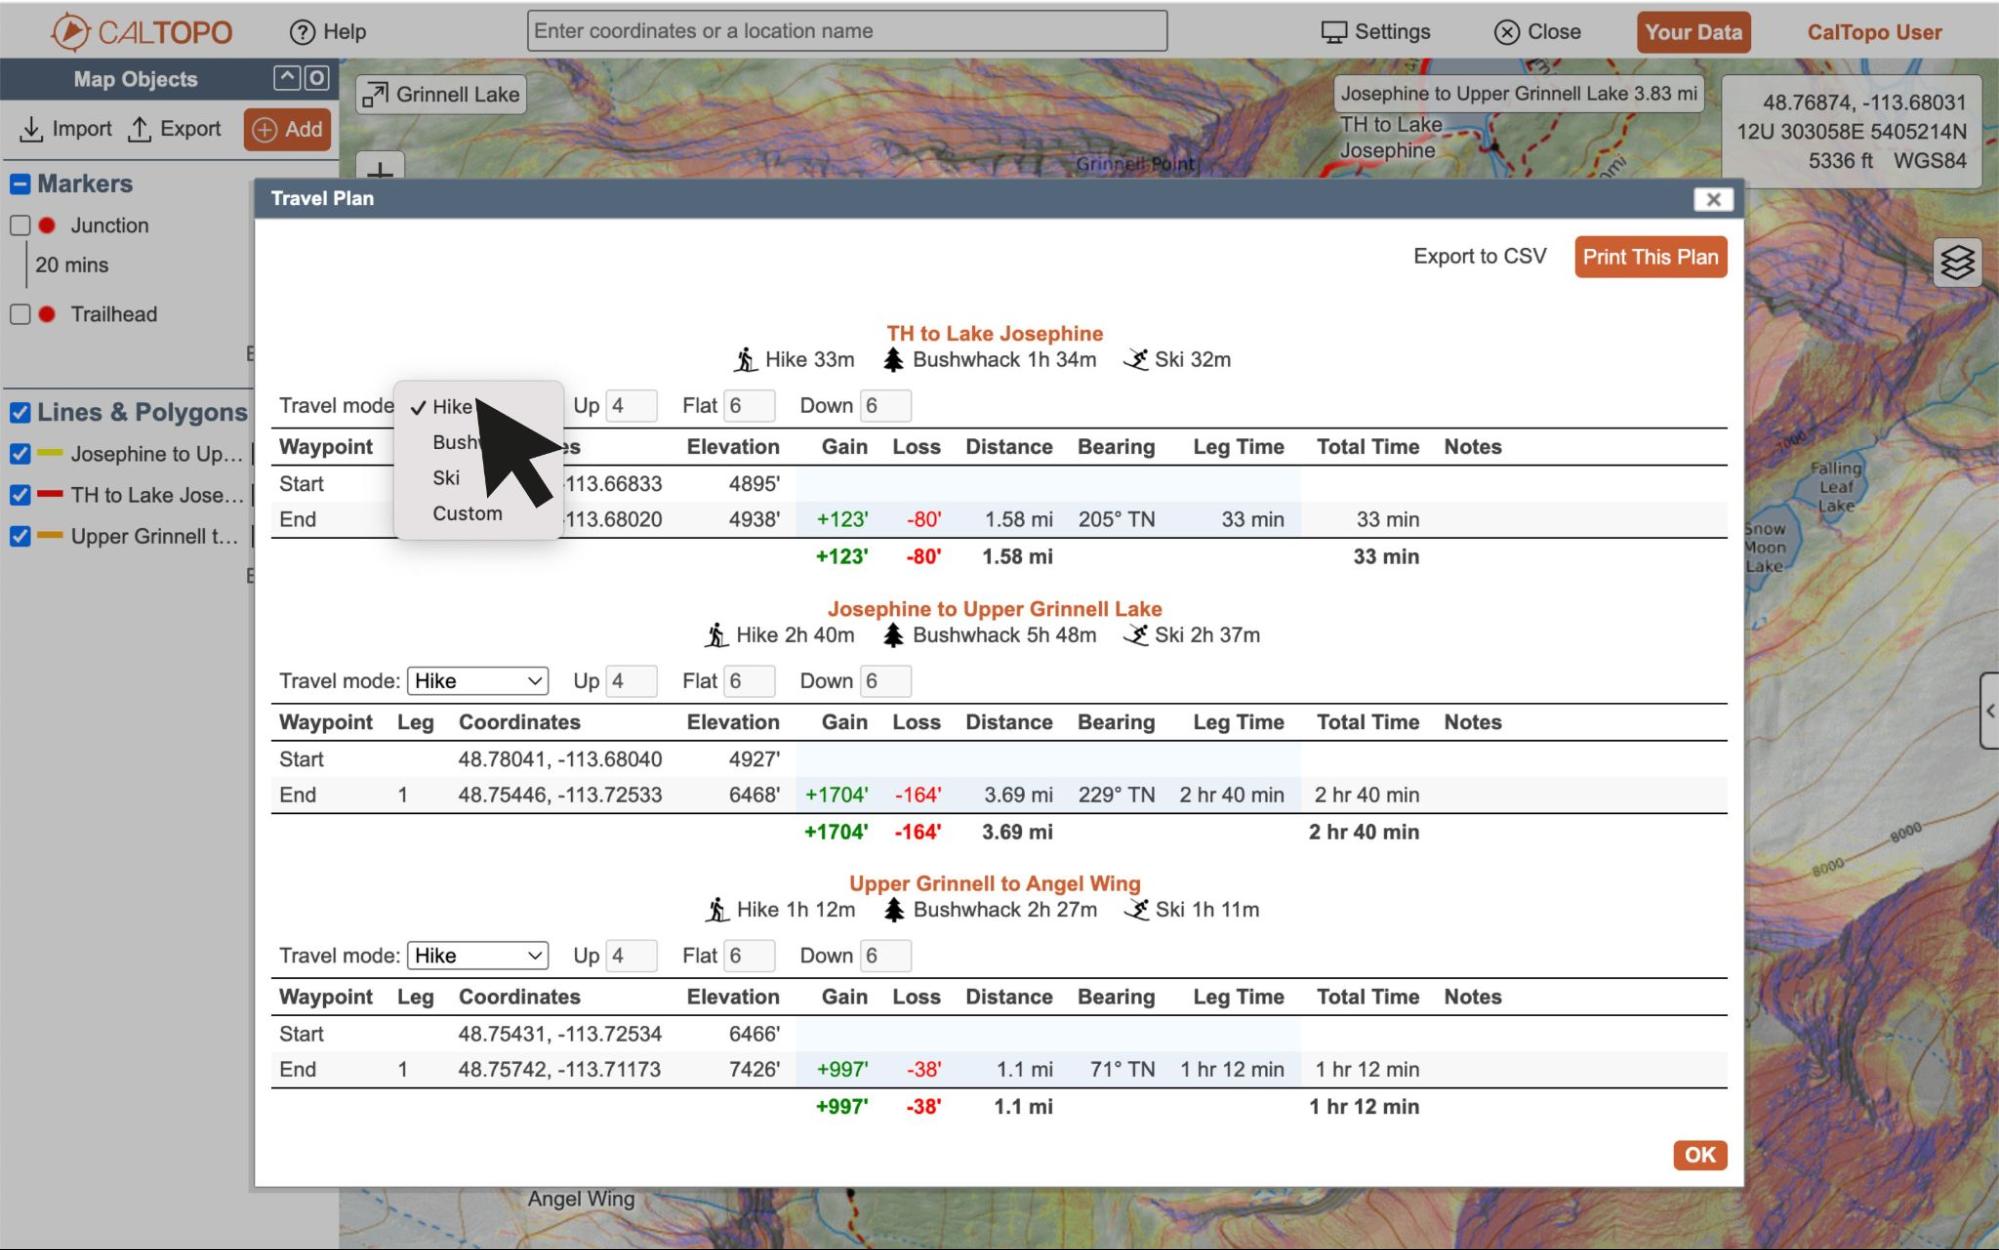
Using the dropdown menu, select the appropriate travel mode for the line. Choosing hike, bushwhack or ski will fill in the accepted generic rates for that travel mode uphill, downhill and across flats. Selecting custom allows you to fill in your own rates.
Travel times will then be calculated for that line based on your travel mode selection using the Munter Method for Time Calculation. The start and end of the line will be displayed and if you’ve added markers along the line to break it up into legs, each leg will be displayed in its own row.
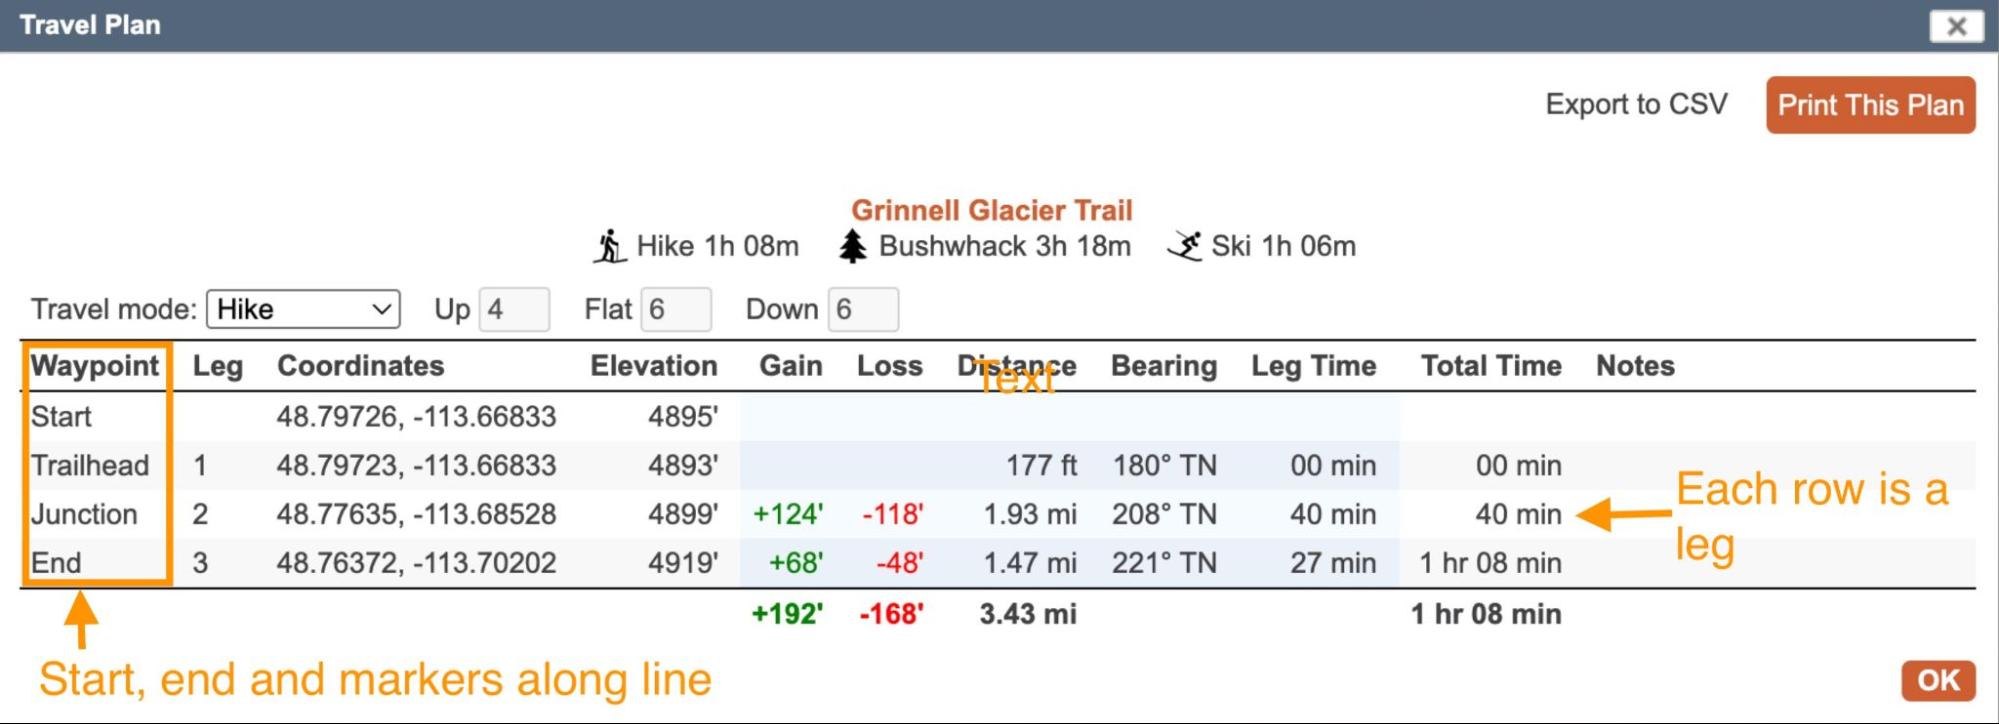
You can also designate breaks by putting the time in minutes in either the marker label or comments.
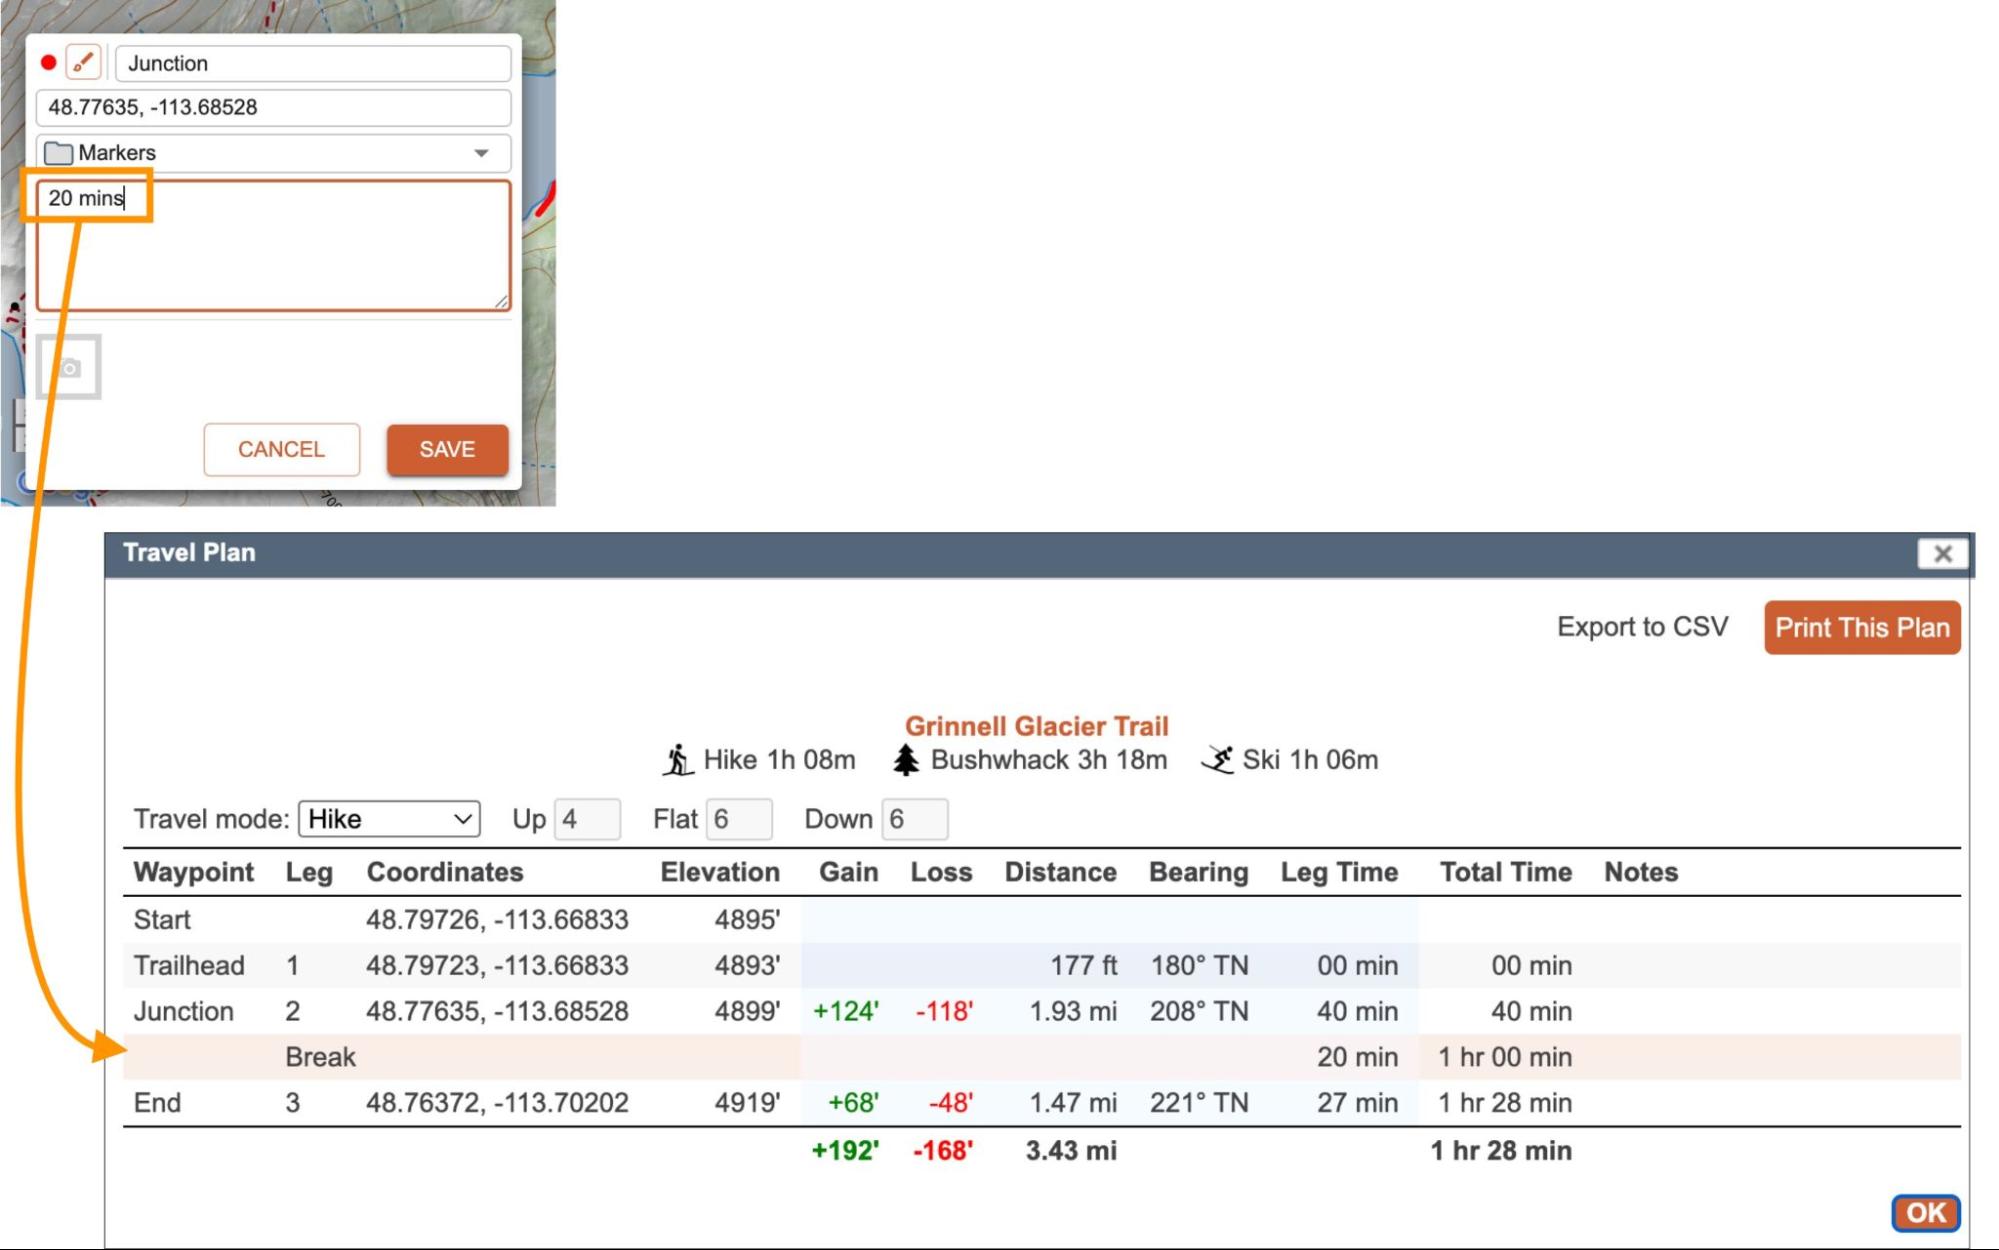
The coordinates and elevation of each waypoint is displayed along with the elevation gain/loss, distance and bearing of the leg between each set of waypoints. The amount of time to travel each leg and the overall travel time based on the Munter Method are also displayed.
It's important to note that in order to make this tool valuable for both new and veteran users, CalTopo applies the Munter Method in 50m increments as opposed to the whole leg at once. For example, if you were ascending a slope broken up by long flat benches, typically you would treat the entire ski ascent as uphill when applying the Munter Method. CalTopo would treat those benches as flat (provided they are large enough), resulting in a slightly different time than you would get with the traditional Munter Method.
This minor deviation from the typical application allows the formula to work even if the user doesn't choose good marker locations for breaking up legs.
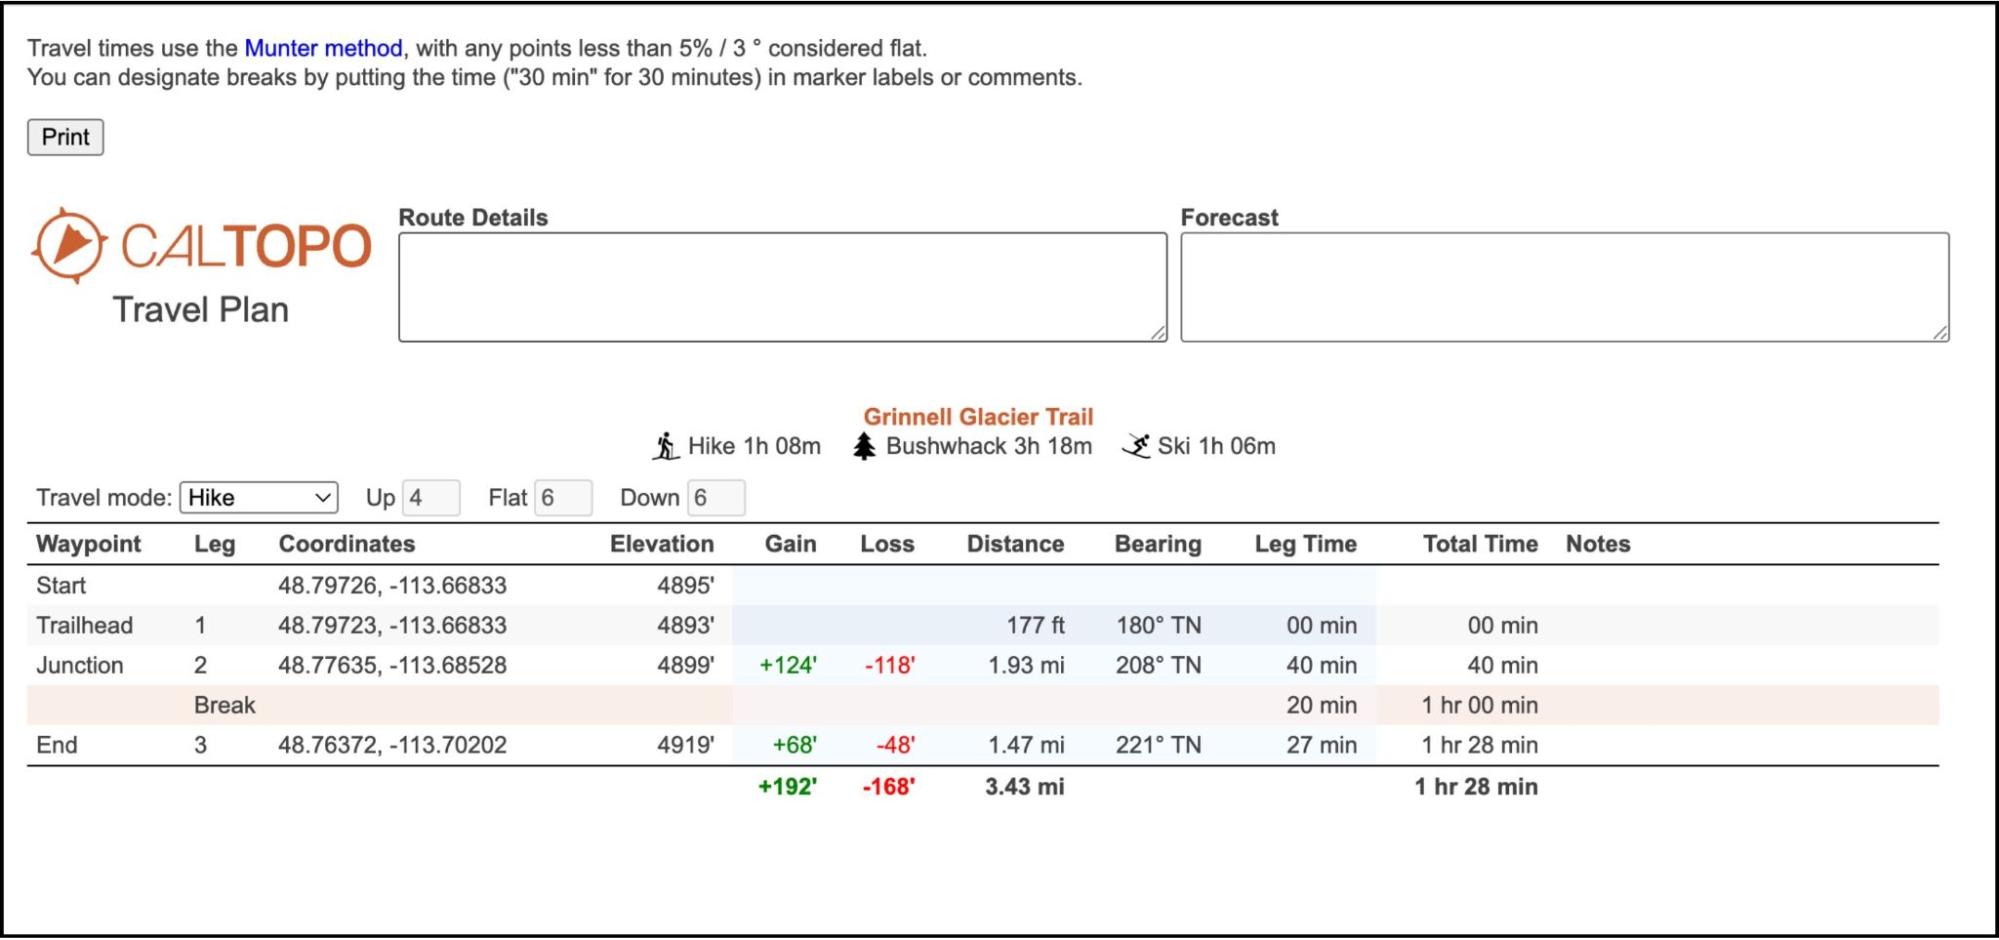
Once you are happy with your travel plan, there are also options for printing or exporting a CSV at the top of the page. Selecting the Print This Plan option will open a new tab with an in depth travel plan with additional customizable fields (Route Details and Forecast).
Using Travel Plan with Multiple Lines
Whether you are planning a ski tour or a backpacking trip, typically you add multiple lines and markers as you build your plan. This is where Travel Plan really shines- if you use the Bulk Ops function, you can display all the lines that make up your trip on the same Travel Plan at once!
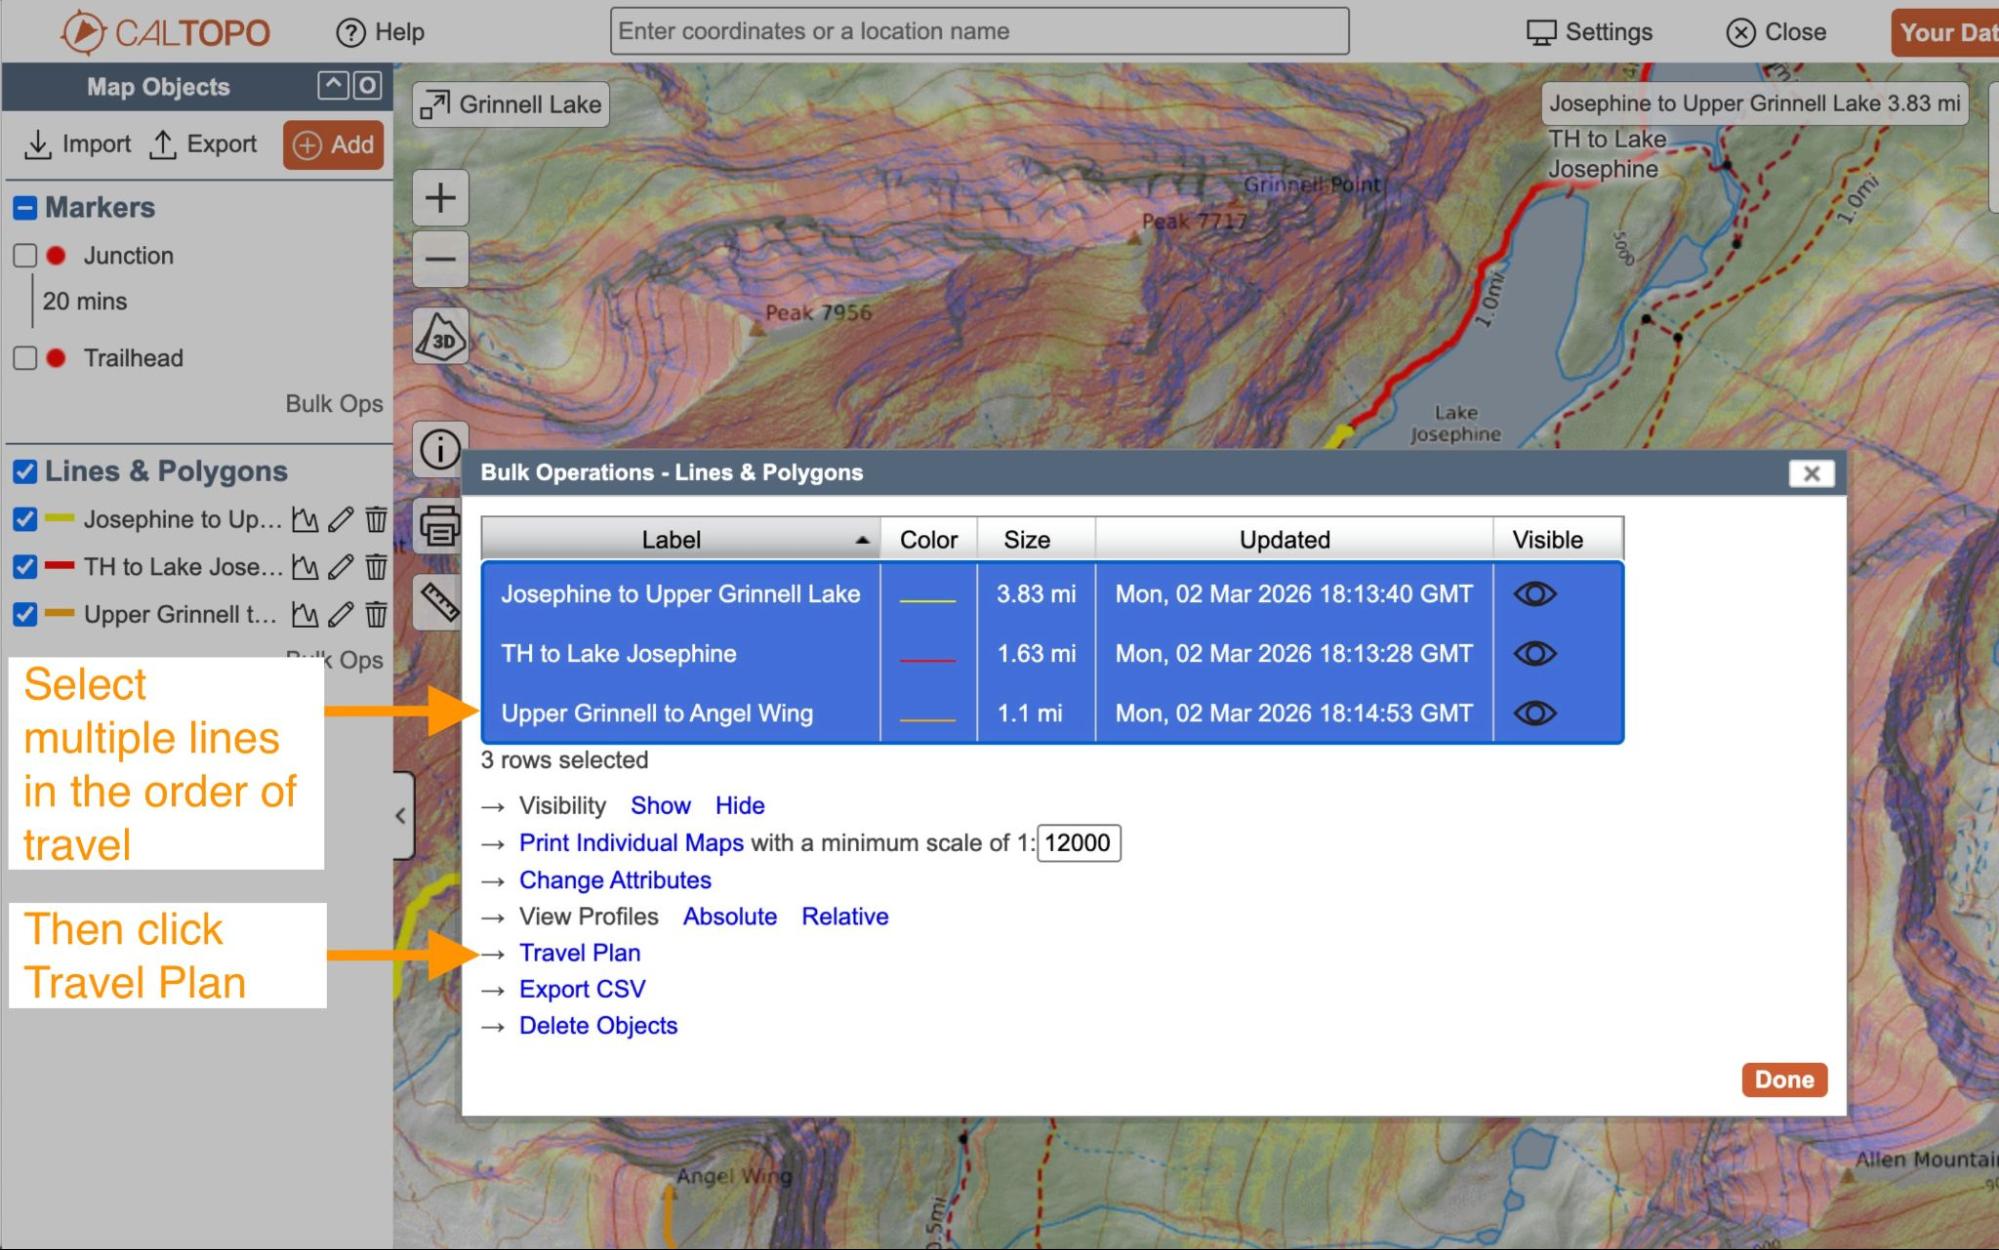
To create a travel plan with multiple lines, first make sure all the lines are in the same folder. Then click Bulk Ops at the bottom of the folder to open the Bulk Ops dialog.
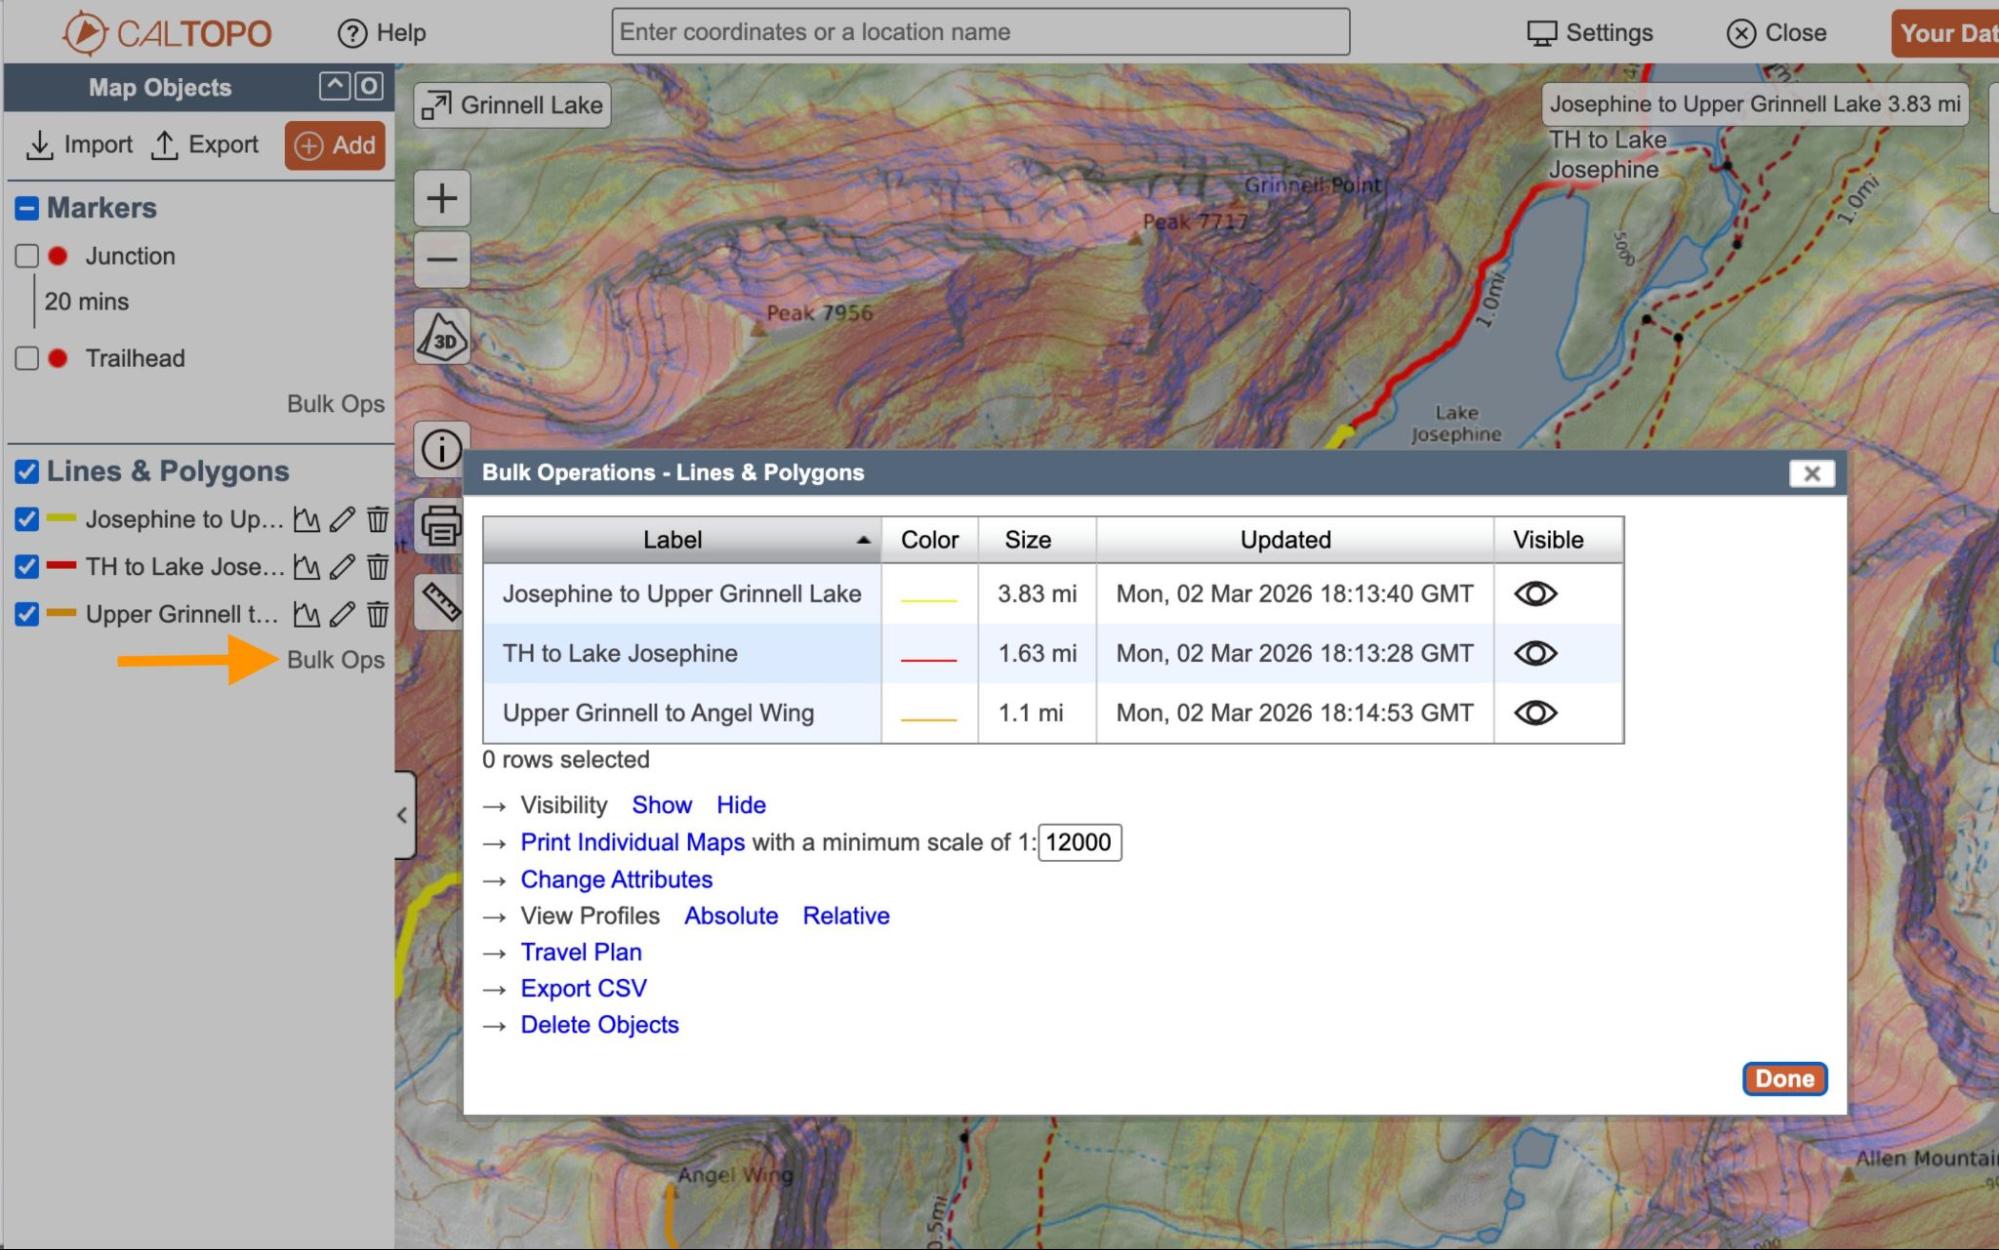
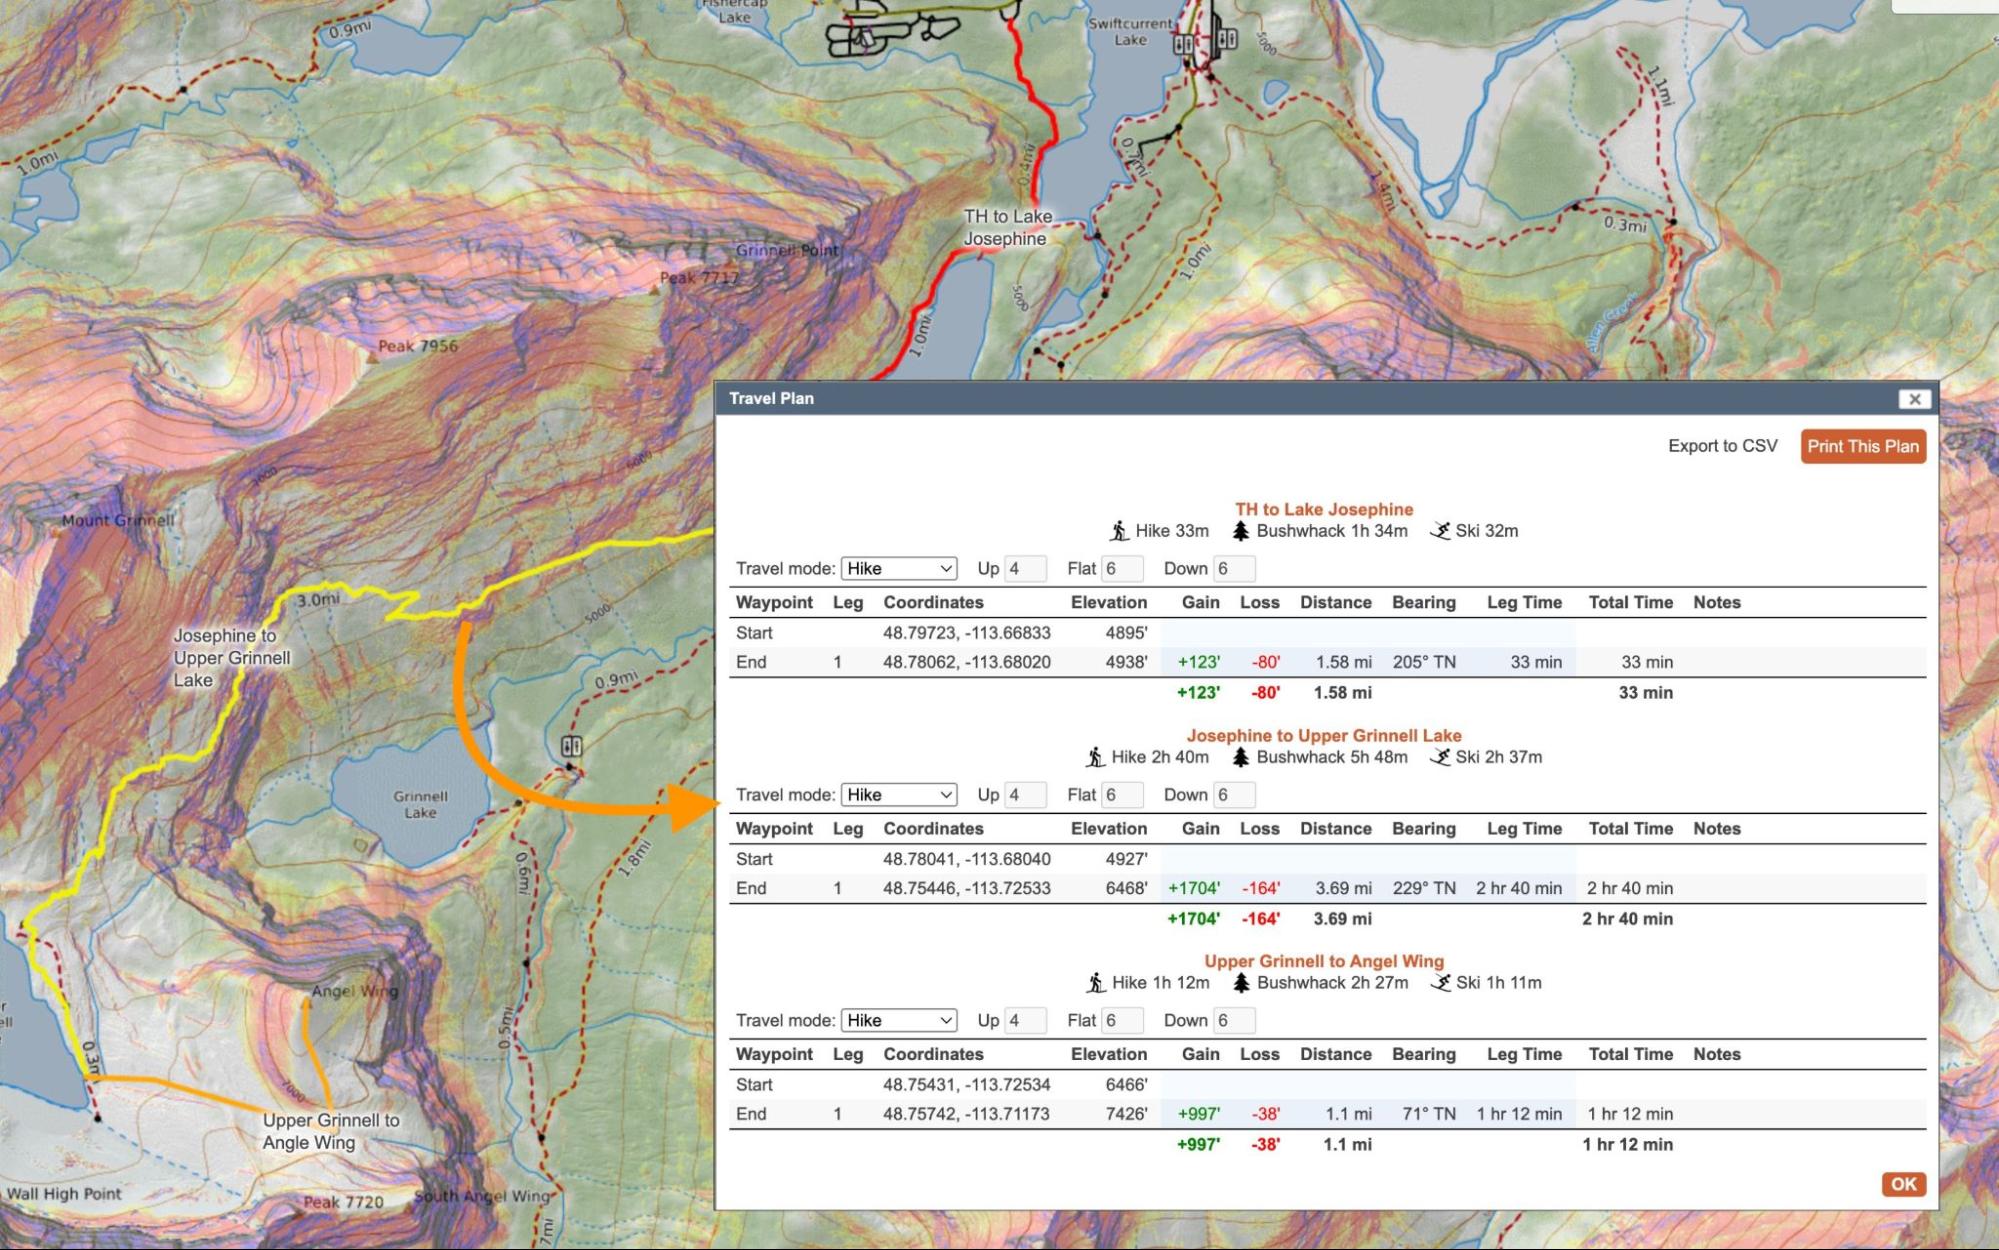
Select all the lines that are part of your travel plan. By default, all objects appear in alphabetical order in the Bulk Ops dialog. If the lines appear in the Bulks Ops dialog in the order you will travel them, you can shift+click the first and last line objects to select the range of objects. However if the lines do not appear in the order you will travel them, use control+click on Windows or command+ lick on Mac to select the line objects one at time in the order that you will travel them. Click Travel Plan at the bottom of the dialog to open the Travel Plan page for the selected lines.
Each line will be displayed in its own section and broken up into legs based on any waypoints that you added to the line. You can select the travel mode for each line individually using the travel mode drop down menus just like you would for a single line.
X Delete
To delete an object, click the garbage can icon next to the object’s name in the Map Objects menu or click the Delete button in the Object dialog. CalTopo does not have a way to recover objects after you confirm that you want to delete them, so be extra careful about deleting objects.
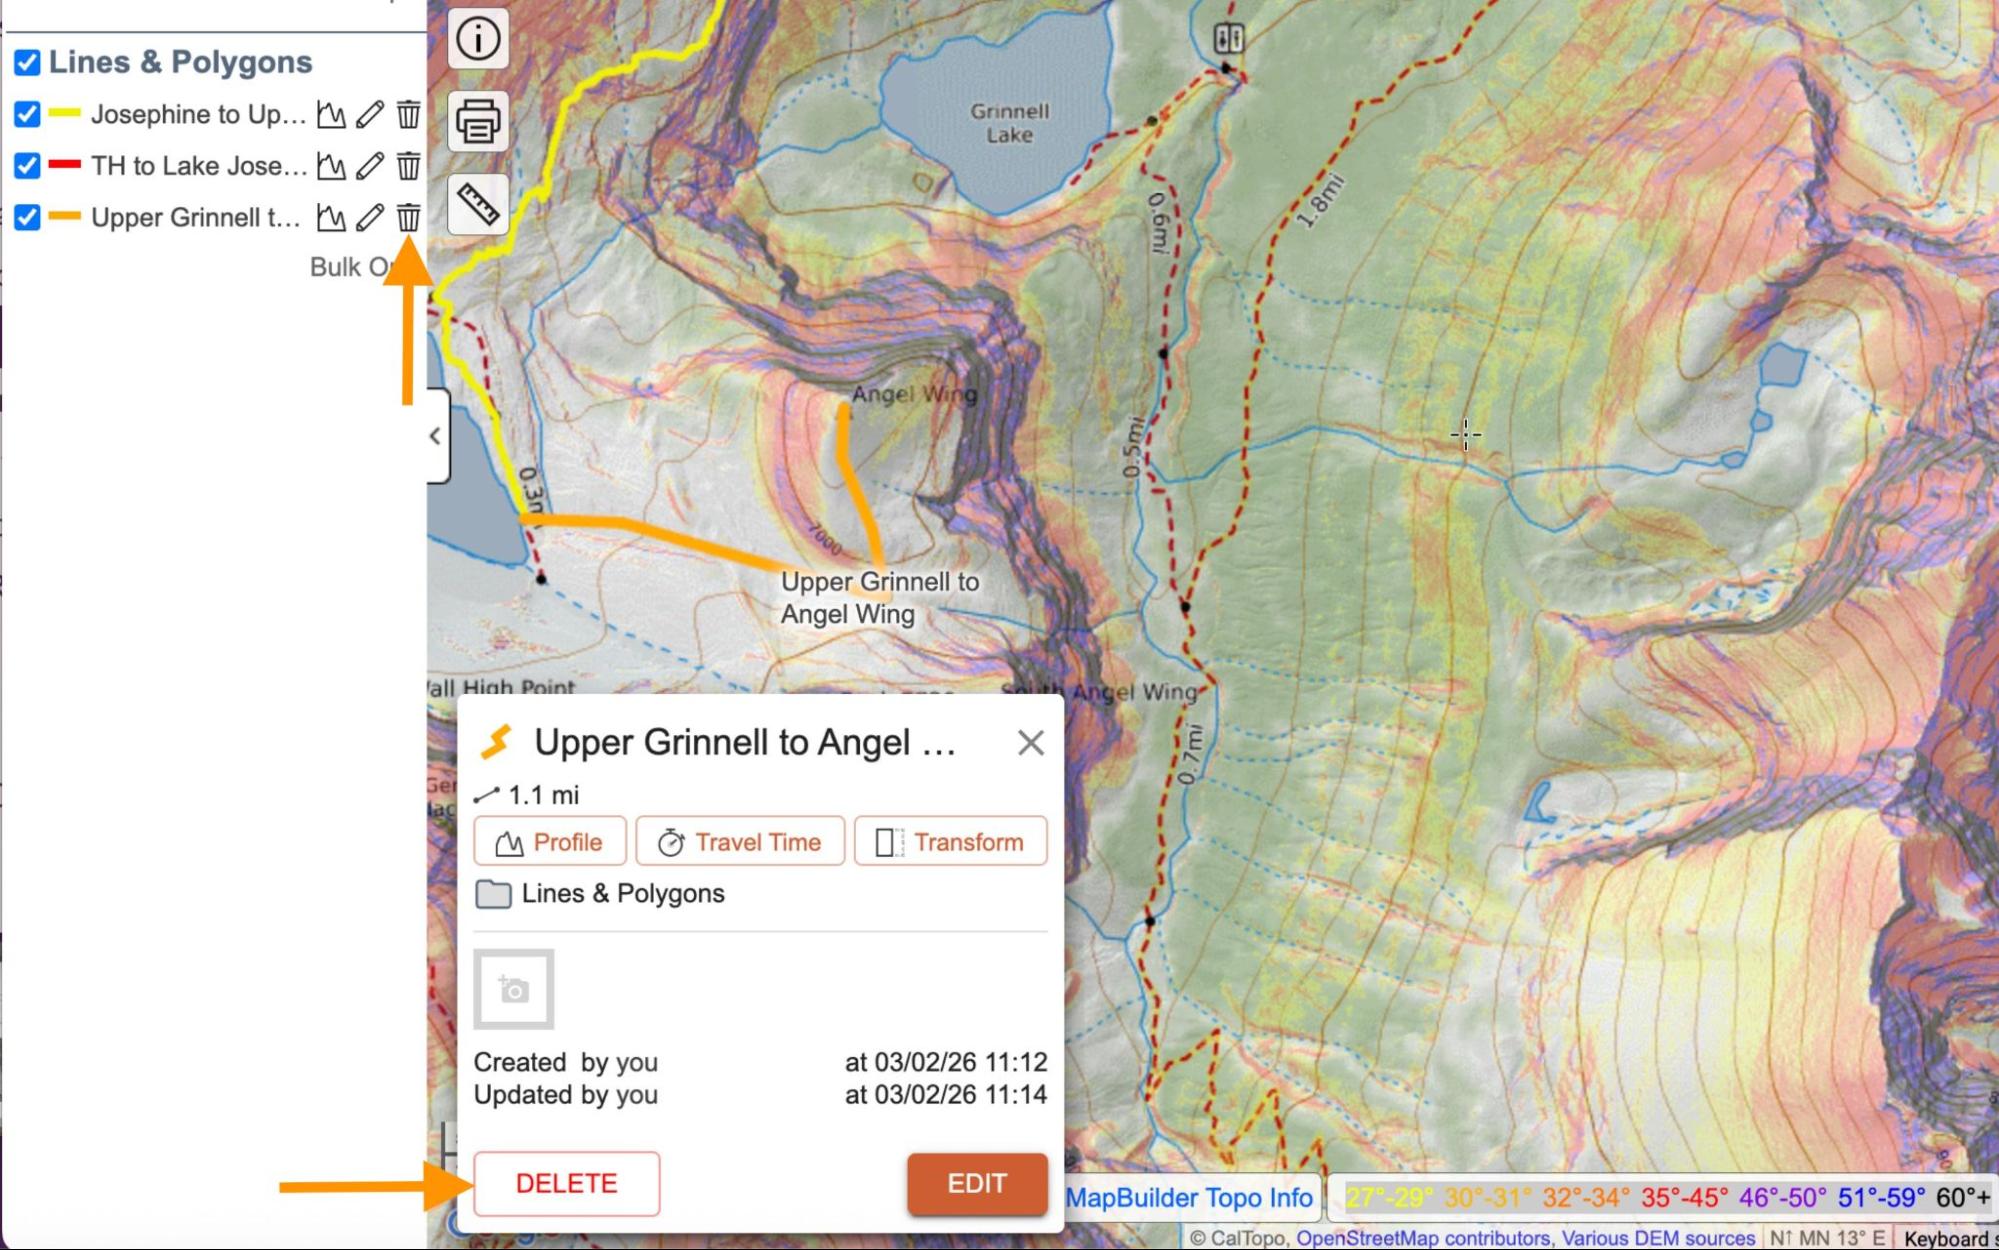
Remember: There is no way to recover a deleted object!
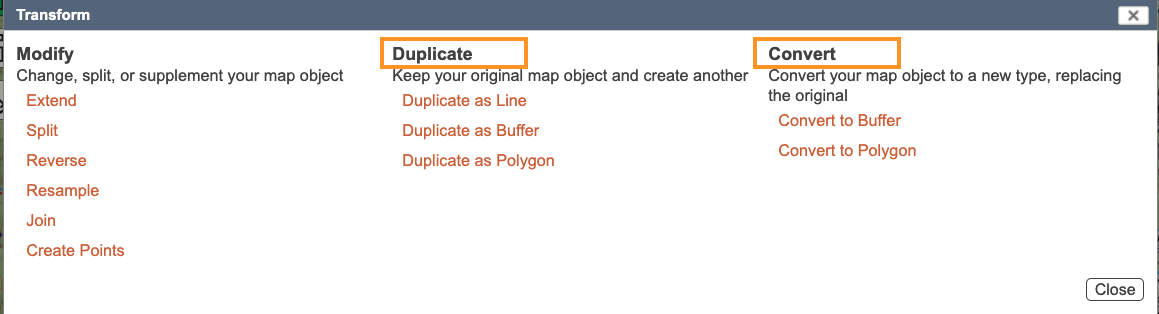
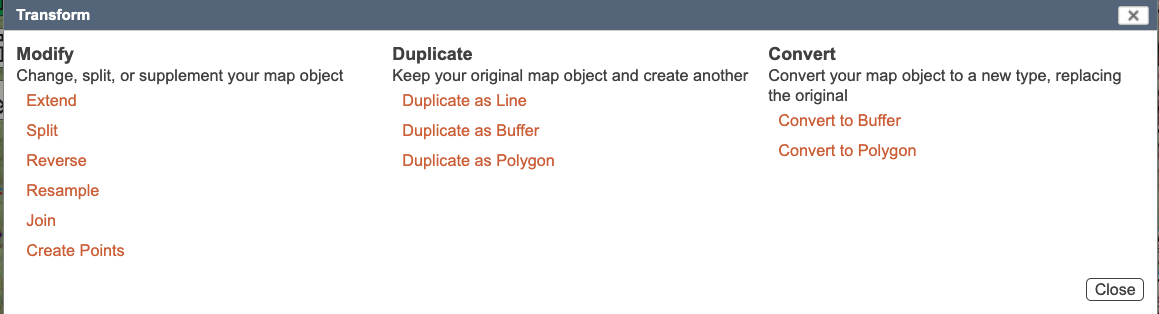
Transform
To modify, duplicate, or convert an object, click on the object name in the Map Objects menu or click on object on the map and select the Transform

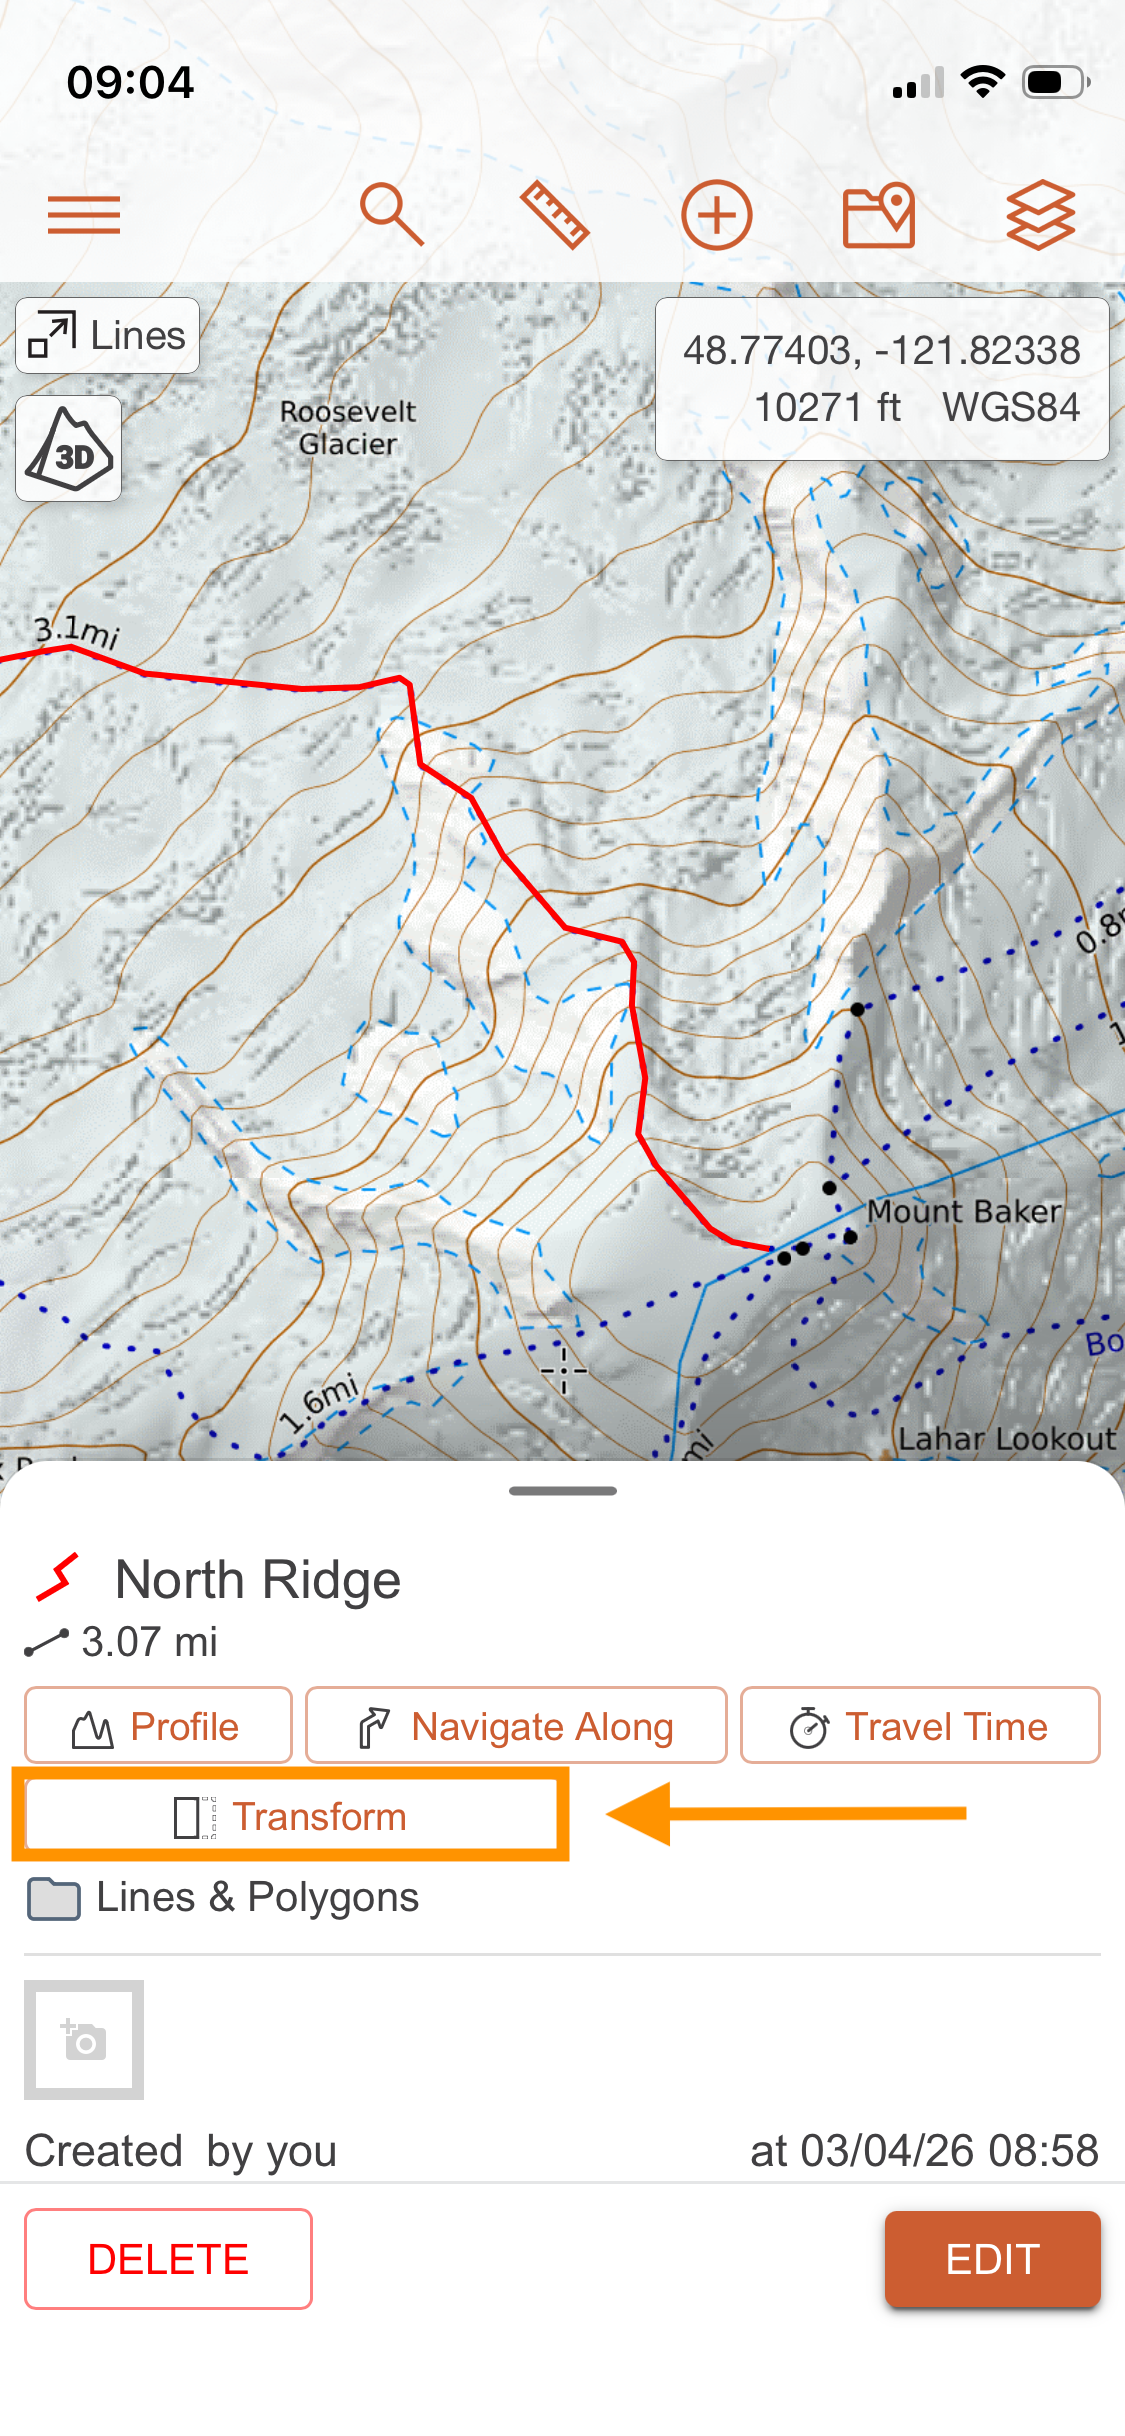
Transform a line on Mobile
In the mobile app, tapping a line gives you the same menu as on the web. By tapping Transform you'll get the same ability to Modify, Duplicate, or Convert.
Extend Line
Extending a line allows you to add additional points to the end of a line. Importantly, the extension will be added to the end of the line, and the last point in the line will be joined to the first point set for the extension. To join the lines as smoothly as possible, you should zoom in to the end of your existing line and add the first new point as close as possible to the last point. Then continue drawing as you would for any line, and double click to finish. (Or use the check mark or hit OK.)
Extend a Line
Watch this short video to see how to extend a line.
If you want to add an extension to the beginning of the line, you will need to first reverse the line, add your extension, then reverse the line again.
Split
The Split function divides a line at a specified point. When you click Transform and select Split, a dialog appears showing the coordinates where the split will take place, along with a dropdown menu. This dropdown lets you choose whether to update the name, the color, or both.
If you choose to update the name, a number will be appended to the original name to distinguish the new segment. If you choose to update the color, the line will change color from the split point onward. Selecting both will apply both changes. This makes it easier to identify and manage the resulting segments.
Split a line.
Watch this short video to see how to split a line into two new lines.
Reverse
The reverse function simply changes the order of the points in the line. This can be useful for routing and for some editing functions (such as extending a line as above.)
Reverse
Watch this short video to see how to reverse a line.
Simplify a Line
Simplifying a line reduces the number of points it contains. The goal is to remove redundant points as well as points created by GPS errors or noise, making tracks both less dense and more accurate. Simplifying a line will not remove timestamps, so tracks can be simplified while retaining that data.
Simplification uses the Ramer–Douglas–Peucker algorithm (RDP). When you choose to simplify a line you will be given the option to choose how aggressively it is simplified. That choice is a distance in meters called the epsilon, which is fundamental to how RDP works.
Imagine you have a track of a ski ascent. The GPS recorded thousands of points along the way, but most of them are so close together that they just add clutter without adding useful detail, or they are offset due to GPS errors. The RDP algorithm looks at all those points and asks "which ones actually matter?" If you choose 7 meters as the epsilon, here is how RDP uses that number:
- Draw a straight line between the first and last point
- Find the point that is farthest away from that line
- If that point is less than 7 meters from the line, it and all the points in between are discarded — they are close enough that they don't add meaningful detail
- If it is farther than 7 meters away, keep it. This creates two smaller sections on either side of it, and the same "draw a line, find the farthest point, throw away the close ones" process runs on each section, potentially finding new farthest points that are also kept or discarded by the same 7 meter rule
The end result is a much simpler version of the track that still looks the same, just with far fewer points. The higher the epsilon, the more aggressive the simplification — essentially saying "ignore anything closer than X meters to the line."
A line can be simplified multiple times, so start with a small epsilon and increase gradually to avoid over-simplifying.
Simplify a line.
Join
Join two named lines to create a single line. The name of the initial line is preserved (i.e. the line you click on before selecting the “join” link.) The end of the first selected line is joined to the beginning of the second line.
Join a line.
Adding Points Evenly Along a Line or Polygon
This is a fun feature that allows you to designate points evenly distributed along a line or polygon. Set points by mile, meter, or feet. For example, you could add mile markers to a line. If you want the markers to match the line name, give them a prefix to indicate the line name. You can start counting at 0 or 1 for labeling the points.
Adding markers along a line
Duplicate or Convert Objects
Any of the duplicate functions will make a copy of the existing object. Duplicating a line as a line will create an exact replica, preserving the name and all other attributes. If you duplicate or convert a line as a polygon, the new object will have a connection added between the first and last points to form an area.
When an object is duplicated, the new copy will have “(copy)” appended to the name. If a copy is duplicated again, a number will be added to the label—such as “(copy 2)”—to differentiate each version.
The convert functions will REPLACE the existing object with the new object.